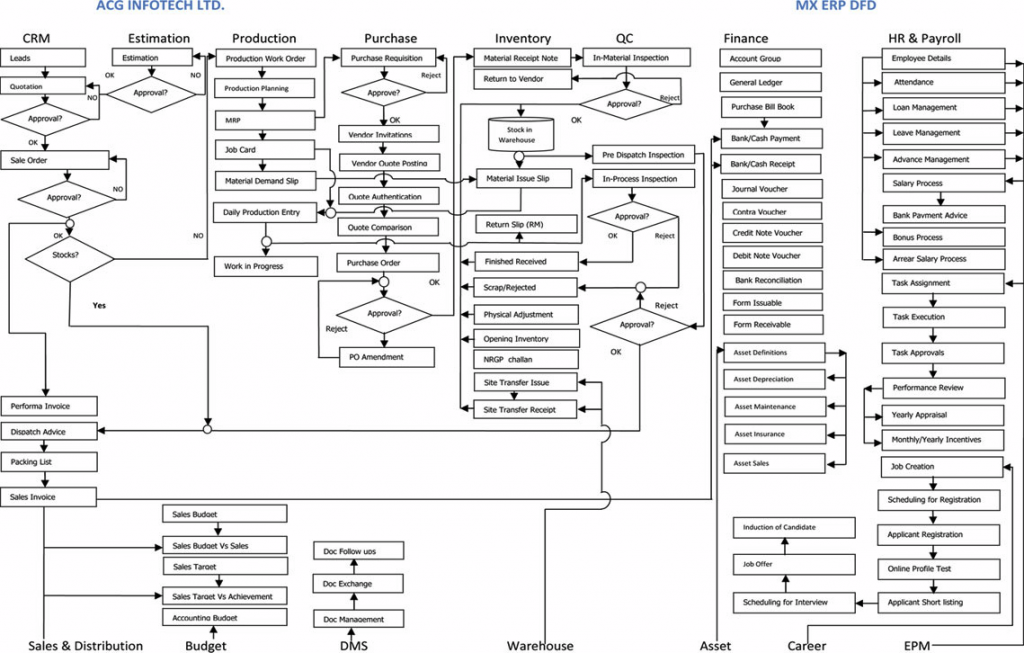
In my early twenties I was adamant I was going to develop an Open Source ERP Platform, now working for SAP, I get to contribute to that dream, but probably will not get a chance to fulfill the base ambition 🙂 This flow chart always helped me understand the many aspects of ERP design, its processes and high tightly coupled each element and step was.
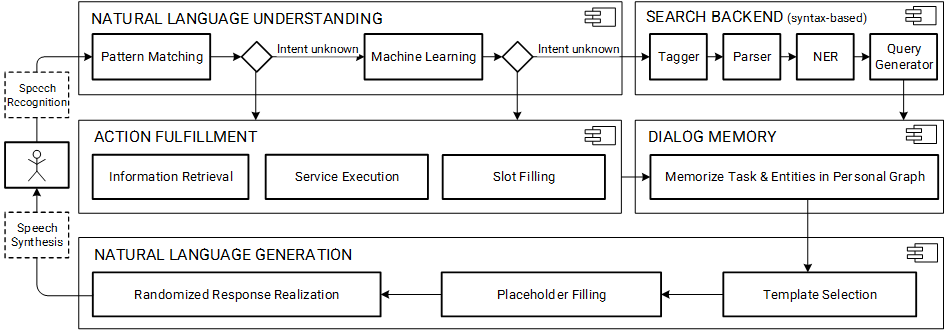
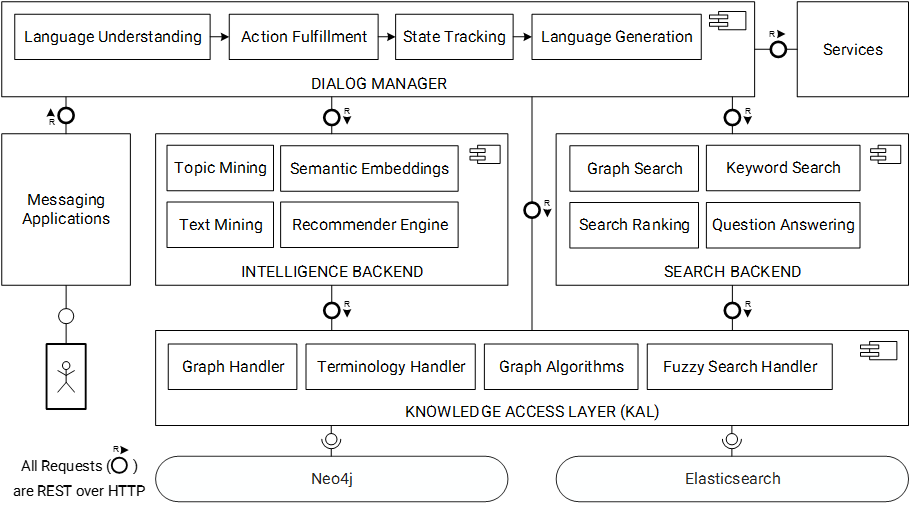
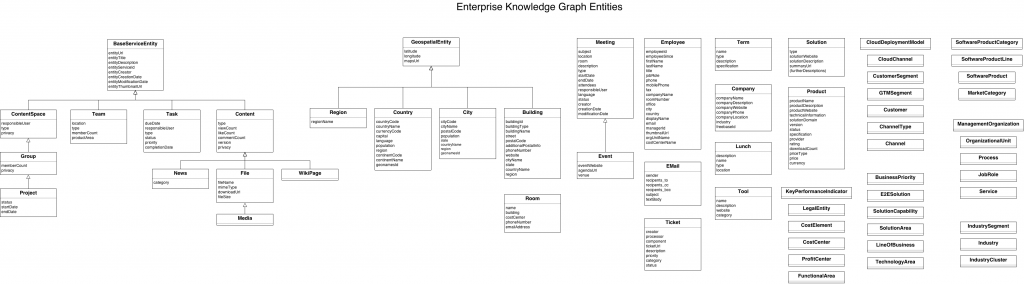
Understanding the ontology architecture of knowledge is a crucial step in moving toward general artificial general intelligence. Over the past few years, the diagrams and slides have helped add some context to the underlying nuances of mapping, processing and predicting natural language and the foundational elements of text.
I enjoyed this article from Max Wessel at SAP talking about how big data is not always the answer, but more specifically that you need the right data. There is a lot to unpack when you start apply and adding your business processes to this context.
The term “big data” is ubiquitous. With exabytes of information flowing across broadband pipes, companies compete to claim the biggest, most audacious data sets. And businesses of all varieties — old and new, industrial and digital, big and small — are getting into the game.
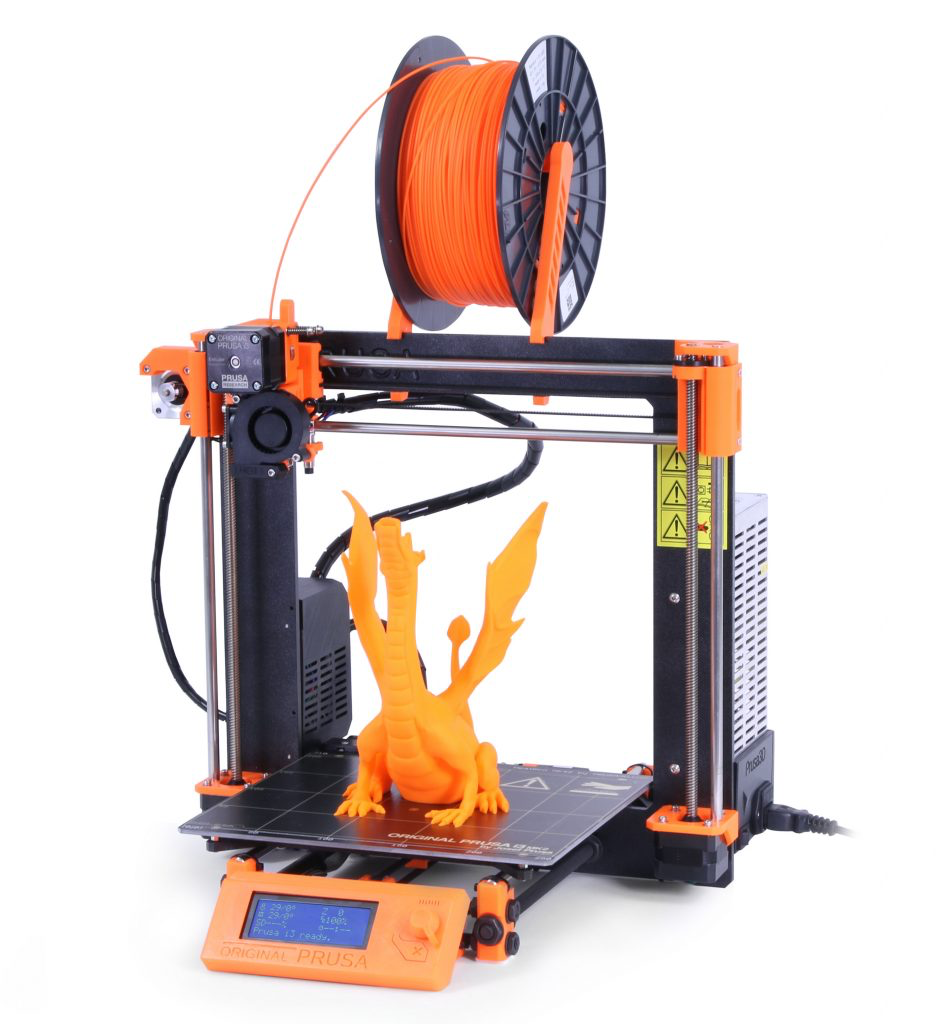
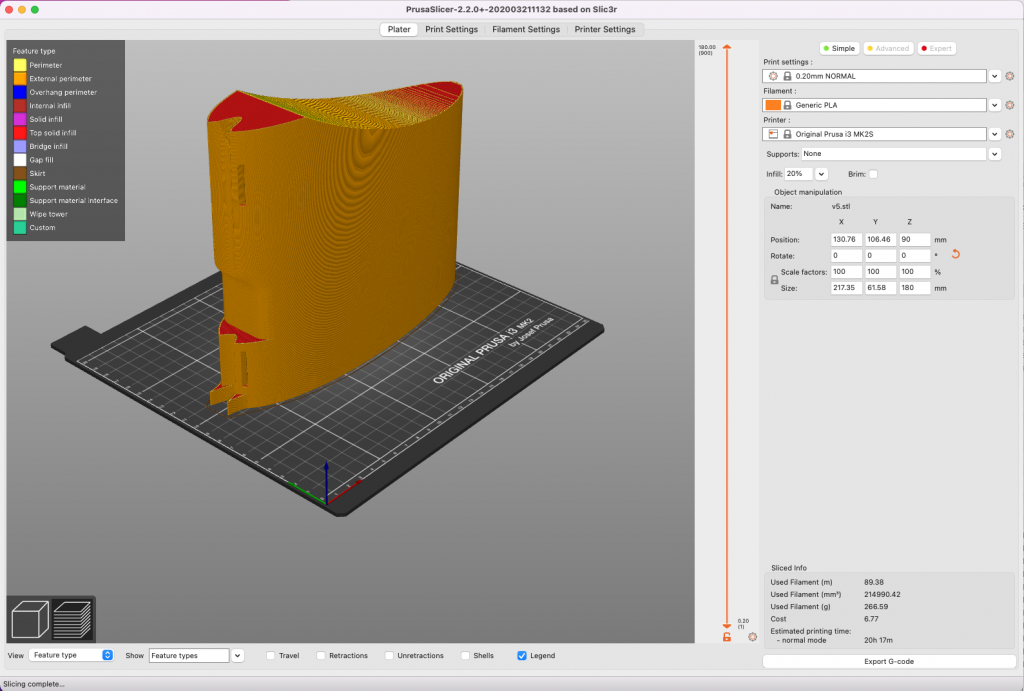
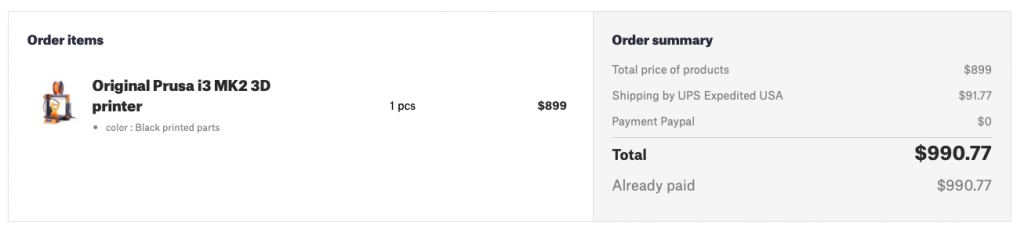
I purchased my first (and still only) 3D printer in 2016, after a considerable amount of deliberation and comparisons, I decided on a Prusa due to the build quality, company history and the great value the company offered.
I have printed around 100 different objects, ranging from practical to pathetic, it’s been a great tool for learning 3D CAD design with tools like Tinkercad and Fusion 360, and the art of invention and innovation. While with this machine the learning curve was fairly steep, I think its a great tool for teaching kids about design, engineering and manufacturing.read more
Being an SAP Mentor I had the wonderful opportunity of meeting and interacting with many different SAP Executives and Leaders (One of my favorite was Hasso Plattner) … and in these meetings we would often chat about technology, platforms, innovation and the future of the company. In order to flip the script a bit and make things fun, I decided to put together a “Cards against SAP” type game, I never had the chance to use/introduce it, but here are a few questions I thought would be fun to ask:
The keynote this morning was completely ruined by _______.
The keynote this morning was awesome thanks to ________.
A SAP product would not be complete without ______.
In the context of SAP Products ….praise _____ , Marry ______, Kill _____.
If I could make _______ happy, my my life would be complete.


You must be logged in to post a comment.