Preparing for SAP Demo Jam at TechEd in Las Vegas was a huge undertaking, I completely underestimated the time and commitment it takes to prep a simple 5 minute demo on the stage in front of 5,000 people. Attached are my notes and details of some of the script around the project and what I was using as a guide.
The store pills should be bigger and center of the screen for everyone to see?
Tell people what you are clicking on?
– Metric squared Twitter Widget: 385571773112012800
Notes
– In Demo – if System crashes … say that I have little kids, any time this happens, mention that it is HANA having a tantrum.
– In Demo – if does not do something … say HANA is a little like my daughter – she doesn’t always listen 😉
– In demo – if system crashes – suggest perfect candidate for Wednesday evening FAIL Faire with Marilyn Pratt 🙂
Demo Jam Widgets
– Makes use of SAP UI5 and SAP HANA XS so additional components and some familiar technology to 15,000 people who signed up for demo jam, and a good introduction for the 20,000 who have signed up for the upcoming training starting next week.
– Mention first time in demo jam history that the audience is going to participate in the demo …
– Real-time web apps are bridging the gap between desktop and browser based apps
– With Metric2 trying to view data differently, simplify and and
– Monitoring the SAP M_* tables and visualizing the system status and subsequently mashing that data up with business success, adding on top of it physical data, really gives an appealing perspective of you business performance.
– The core feature is how easy it is to display, that its in real-time and that anyone can do it from anywhere.
– Leveraging HANA Speed and ability to collect all this big data, summarize, aggregate it and display it in a simple package
– Also makes use of its predictive analytical capabilities to analyze its own system performance and for example, predict when the systems performance might reduce or crash.
– What I have done is gone and developed over 30 visualization and widgets which enable you to monitor your SAP HAVA Database and the applications easily
– Predictive alerting – using the power of HANA, we can set our alerts to have predictive capabilities, and in the background execute the procedure. In the event the value will exceed the target you have set, you will see a notification.
– coined the term enterprise of things
As you can see, super easy and friendly, a great example of how IT and the business can build tools which work together to make the business more successful. Data for these dashboards can be sourced from multiple systems, and not only IT but also physical sensors to help in building a story behind your business success.
Presenters Intro:
Earlier this year I was looking into how companies, especially in the online space we using real time dashboards to react to market and business changes. What also really got my attention was how companies were using these realtime dashboards to innovate, and essentially experiment with their business and be able gauge the impact in realtime. I really believed that the enterprise would benefit from having these insights. So between now and then I went through the online openSAP course, drank the koolaid, and really though the HANA DB and XS engine would be a great platform for realtime dashboards and subsequently developed a small free app called Metric2.
Earlier this year I started noticing a trend in the online world where websites were using realtime metrics to gauge user impact and business performance,, what also really caught my attention was how businesses were essentially experimenting with process, UI and content changes and gauging reactions and impact in realtime. I really believed the enterprise could benefit from this type Thanks to my curiosity and the openSAP course, I drank the hana coolaid and was really impressed by the DB and the application server, known as the xs engine.
– Metric2 is a web based realtime monitoring platform for SAP HANA databases, servers and applications.
– IT Dept perspective
From a administration perspective there is currently no software for monitoring HANA systems in real-time. HANA studio is the closest application and it does not do a very good job at showing your business the impact of HANA, nor does it easily show your IT team the operational status of the system and the applications it is supporting. Outside of HANA Studio, there is also no tool for tracking the history of important HANA metrics, or anticipate how your system will operate in the future.
Our demo show how to improve the life of the person tasked with the administration of HANA systems by providing an easy to use application for monitoring HANA systems in real-time. It goes beyond what is offered by HANA Studio by, on the one hand, showing to the IT team the operational status of the systems and the applications it is supporting and on the other hand showing to business people the impact of HANA. Our tool is called Metric² and is a free real-time monitoring and dashboard tool for SAP HANA servers, databases and applications. Metric² builds on the impressive power of HANA and its supporting tools by complementing them in key areas.
| Matrix Screensaver | Emotional link to challenges 1, 2 and 3HANA CourseCoolaidHelp OperationsShow HANA Impact -> developed M2Web based realtime dashboard platform——————————————————————————————————————————————–So a couple of months ago I was going through the online open SAP HANA course, during which I developed some pretty useful applications and “drank the hoolaid” was impressed by the performance of not only the DB but also the app server. I also wanted a way to show companies the Impact HANA was making on their business, so subsequently, I started developing a free app called metric2.Metric2 is a web based realtime dashboard platform which makes monitoring a HANA database or applications running on HANA, simple and ensures that key metrics are visible and brought to peoples attention. |
| Overview dashboard | Large FormatFoundation = fast responseVariety = end to endReal timeDon’t see what you need?——————————————————————————————————————————————–Metric2 is designed for large format displays, like office or department monitors.The foundation of this application are its Flexible dashboards,which guarantee a faster response to potential issues from multiple aspects of the business.Here you can see a dashboard showing some of the core key metrics to ensure that HANA is performing optimally.As you can see, there are a variety of widgets from Social media through to actual application data, this is really nice as its giving us the end to end status of how our business is succeeding.As you may also notice, data is being updated and displayed in real-time thanks to the power of the built in HANA XS Engine.But what if you wanted a little more, maybe something you don’t see on the screen which you want to add? |
| Add Widget – 2 mins | > 40 essentialsadditional customizable, or customSQL, web services, external apis and traditionalPhysical thanks to API——————————————————————————————————————————————–We have pre built over 40 important widgets for for the app, which are essential for any business, DBA and IT team. still not enough, there are additional widgets which are fully customizable, add your own SQL or pull from a variety of REST based web sources including your SAP ERP or CRM system thanks to Gateway, all within the app.So thats neat – you know pulling data from external systems, but widgets, can also be physical – Thanks to the apps API, up on the screen is a temperature sensor, which in our case is measuring the ambient temperature. This concept of realtime web apps, sourcing multiple pieces of data using both push and pull communications is a great foundation for showing the value of the “Internet of things”.So thats pretty cool – it shows you realtime data coming from a variety of data sources, physical sensors, and web services both out on the net or from traditional systems like ERP or CRM in a realtime dashboard. |
| History Tab | History importantMonitor past and presentUsing PALOn the flyPredict crashes——————————————————————————————————————————————–History is an important aspect for troubleshooting issues, so you can select on any widget and display its data over a period of time.so as you can see, with just a few clicks, we can monitor the past and present of just about any datapoint within your enterprise, and that is thanks to HANA’s capability to store large amounts of historical data and retrieve it really quickly. But what about the future, we also using HANA predictive capabilities. If we click forecast from the history screen, HANA will actually predict the anticipated data values for any of the items, or even custom queries you may have specified. all in a web front end, on the fly, and in some cases close to real-time. As you can see from the chart up on the screen its predicting our avg CPU load is going to dramatically increase over the next couple hours …. so if our system has crashed a couple times in the past, we can use hana to predict when hana may crash again … |
| Alerts | With metric2 you can monitor just about any item being captured on your dashboards. So not just system info, but also your sensors or sourced data.Here you can see this 1st event, showing DB CPU exceeding 80% has been captured around 1000 times already, |
| Alert History | Clicking the count shows us some historical details around when this occurred, and it can help us anticipate when it may happen again. |
| So these are just a few of the features of Metric2 …. | |
| 3.5 mins max? | |
| but there is something I need your help with … I would really like to put HANA and my realtime dashboards to the test | |
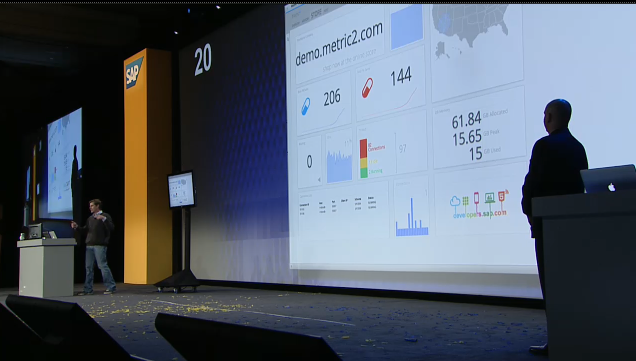
| Store dashboard | So here is a use case …. take the Matrix company – they are a large online retailer running their ordering systems on SAP HANA, they are also using Metric2 to monitor their systems KPIs and also some key business details.You can see up on the screen that I have created a Store dashboard with some key metrics related to the matrix online store. |
| demo.metric2.comURL | I would like all of you to open your smart phones or browsers to demo.metric2.com …. and decide which pill you would like to purchase. The blue pill – leaves you in the fake or as I like to call it, ‘Oracles’ world, or buy the red pill to show you the truth and metric2 can show how deep the rabbit hole goes. |
| Store Dashboard | So as all of you do your shopping, our dashboards key vital signs are going to start changing in realtime, and pending no hiccups – we should see these up on the screen in real time.As you can see the KPI’s are increasing, the pills orders are increasing and we can all see that the “reality” pill is coming out on top. We can also see the system connections are skyrocketing. Down at the bottom of the screen you may also notice the alert threshold has been met so this is kicking off our notifications.So its seem Neo is a fan favorite 🙂 |
| Closing | Whats cool is that this is all a single free HANA machine, running on amazon AWS, and for reference, this is what the openSAP course taught and inspired me to do.Metric2 is a native hana application and runs directly on the hana application server, so no additional software or infrastructure and actually this can run on a developer machine, in was or wherever your hana instance may be.So, just like the pills on the online store, Metric2 is a free app, I encourage all of you to head over to metric2.com and download a copy. Conceptually the web development world made some great leap and strides with HTML5, but realtime web apps I believe will bridge the gap and really provide an obvious benefit in encouraging companies to move from native apps to web apps. |
| Matrix Screensaver | – Simple- Ensure |
| Overview dashboard | CoreVariety of widgetsRealtime=End to EndFree Developer editionMaybe a little more? |
| Add Widget | Pre built over 40 includingPretty neatBUt also Physical= IOTUseful |
| Alerts | Simple StudioCustom alerts and sourcedDB CPU |
| Alert History | Click |
| Overview dashboard | Switching back |
| History Tab | History = important featurepast and presentuse PALin real-timejust a few features |
| 3 mins | |
| Help test | |
| Store dashboard | matrix companyusecreated store board |
| demo.metric2.comURL | small challenge for youblue = fakered = truth |
| Store Dashboard | vital signs changingincreasingalerts |
| Closing | great = free app – free dev serveropen sapdownload today |
You must be logged in to post a comment.