Designing, building and then using something you have made, has been one of the most rewarding and personally satisfying activities I have found in my life so far. I was born a tinkerer, always disassembling, trying to understand and improve or recreate.
My favorite TV show is “How it’s made”.
I have way too many expensive tools, printers, cutters and machines, and not a single one has made a significant return on the investment … but, what I have learned using them has been 10x …
Its not just the tool, its the tools to use the tool, the software to design the product, the process to start, run or finish the machine or product, the prep work, consideration and the functionality.read more
This weekends challenge, a better hook for a bicycle:
Want to laser cut one of your own or remix it? Check it out on Thingiverse
This is a vertical based bike hook for bicycles with aero (deep) front rims. Currently there are not many wheel hooks that keep the front wheel vertical and that don’t scratch the rim when putting the bike up.
The hook is lasercut using a glowforge and medium draft board (the material thickness is important as all the slots need to interlock). Assembly is slotting the parts together and installation requires two screws/anchors into the wall.
It was specifically designed for a Reynolds AR80, however, I believe other wheels with similar dimensions, depths or profiles should fit.read more
Over the past few years I have found myself re-implementing and re-writing basic features of server, web, mobile or service components. Registration, Login, Forgot Password, Notifications, Search, Help, FAQ, Contact Us, Maps are just a few I can think of, where half way through the development everything seems familiar and I have a case of deja vu. No doubt I have written or implemented a library or service which performs this specific function.
While developing the Changd app I found myself in one of the deja vu moments while writing the email notification service, and decided to pause development, and fix the root cause. After multiple Github issues to support a variety of notification providers, I came across Apprise, a python library which supports multiple notification provides. Since there was not a Node.js implementation, I decided to use Apprise as inspiration and influence for a Node.js library which I aptly named “Reach”.read more
One of the benefits of Quantum Computing is their ability to generate truly random numbers.
Since classical computers are deterministic machines, governed by algorithms, they are inherently predictable. Therefor any number generated by a classical computer, even if it seems complex is actually based on a set of conditions or algorithm, which therefor makes it a “pseudo random number”, rather than truly random.
To generate truly random numbers you need to rely on a physical processor or phenomena that are unpredictable, examples of this include radioactive decay, electronic noise or even atmospheric noise.
Since QC is essentially based on a physical process and the probabilistic nature of quantum mechanics, its qubits can exist in a superposition state, this means they can represent a combination of 0 and 1 simultaneously, this state/property can be harnessed by QRNG (Quantum random number generators) to produce truly random numbers.
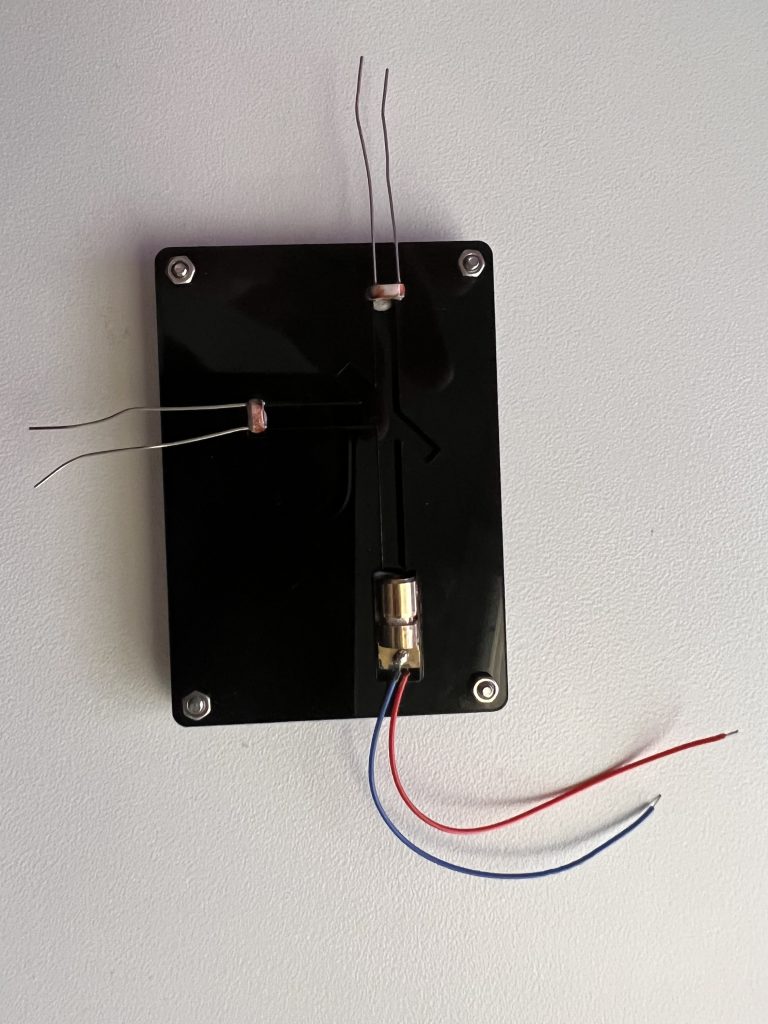
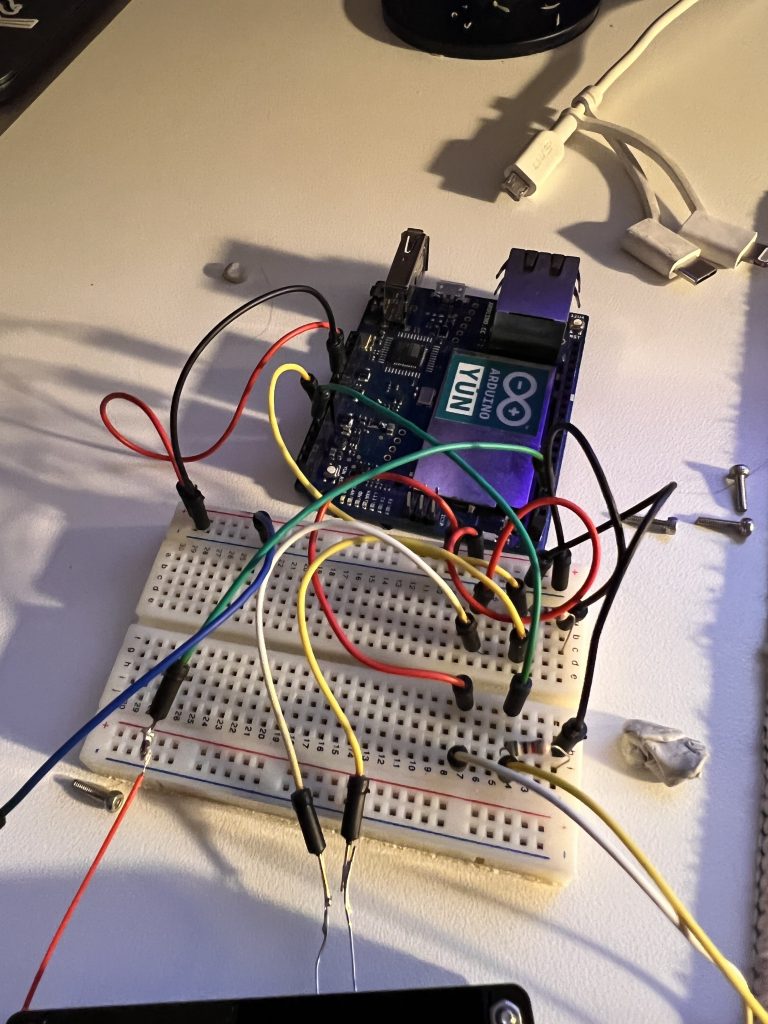
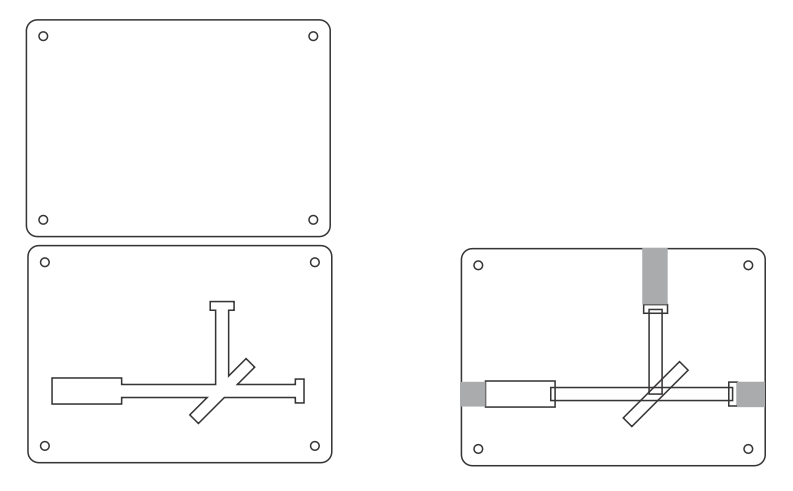
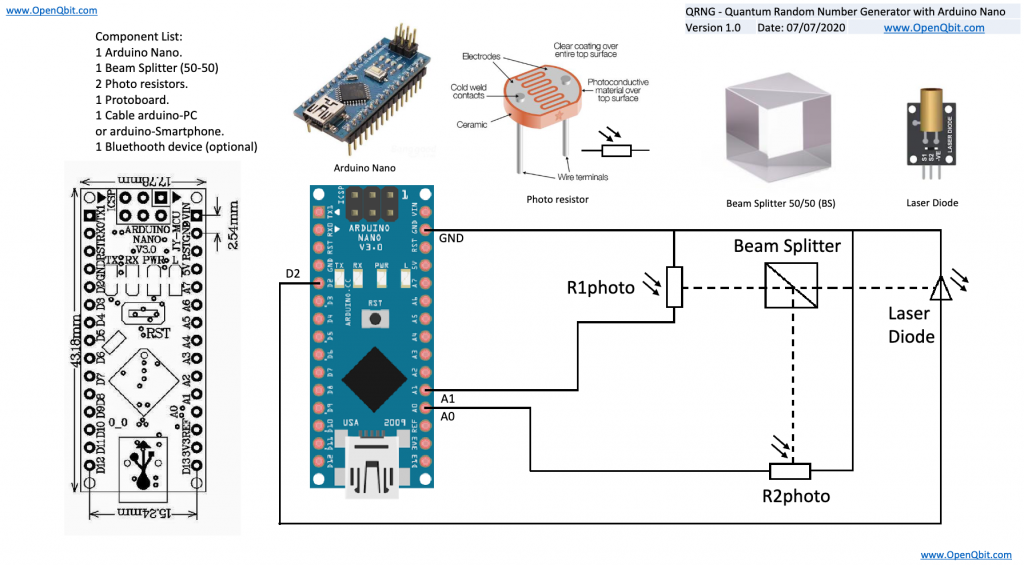
As a fun project, I decided to build a small physical QRNG using an Arduino, laser diode, beam splitter and two photo resistors. The basic premise is that you pulse the laser, it sends a wave/particle (both!) through the beam splitter, 50% of the time it should hit one of the two photo resistors, providing you with a random string of “1”s or “0”s.
While a very simple, basic and small example, it is a fun experiment. Check out OpenQbit.com if you would like to build your own. To make this a little easier, I laser cut a template/outline for the beam splitter for holding each of the components.
/*      Annotated QRNGv1 Firmware V1.1
   Author: Noah G. Wood
   Modified: Paul Aschmann
   Copyright (c) 2019 Spooky Manufacturing, LLC
   License: GPLv3.0

*/
int triggerPin = 2; // This pin will pulse our quantum circuit
int hPin = A0; // This pin measures the horizontal polarized photons
int vPin = A1; // This pin measures the vertically polarized photons
float H = 0;
float V = 0;
long previousMillis = 0;
long interval = 1000;
float maxH = 0;
float maxV = 0;

void setup() {
  // Just setting up triggerPin and serial connection
  //pinMode(13, OUTPUT);
  pinMode(triggerPin, OUTPUT);
  Serial.begin(9600);
}

int Random() {
  // Pulse the laser
  digitalWrite(triggerPin, HIGH);
  //delay(1);
  digitalWrite(triggerPin, LOW);
}

void loop() {
  // The main program
  // Run our program and print the random bit to serial
  //delay(1000);

  unsigned long currentMillis = millis();

  if (currentMillis - previousMillis > interval) {
    previousMillis = currentMillis;
    Random();
  }

  // Read the photoresistors
  H = analogRead(hPin);
  V = analogRead(vPin);
  // Determine random bit
  if (H > V) { // More photons in the H mode, return 0
    Serial.println("-------------------- >  H: ");
    Serial.println(H);
    Serial.println("V: ");
    Serial.println(V);
    if (H > maxH) {
      maxH = H;
      Serial.println("New max H");
    }
  } else if (V > H) { // More photons in the V mode, return 1
    Serial.println("-------------------- > V: ");
    Serial.println(V);
    Serial.println("H: ");
    Serial.println(H);
    if (V > maxV) {
      maxV = V;
      Serial.println("New max V");
    }
  } else {
    Serial.println("Same values");
  }
  delay(1000);
}
read more
This is another blog post of a series around the enterprise mobility IT team at SAP. We are an internal team focused on managing mobile devices, mobile applications, and developing custom apps for SAP’s 100,000 employees. I believe we have some unique stories, software, tools, and insights to help others in the community considering, or currently undertaking, some of the challenges which surround mobility and its adoption in the enterprise.
Introduction
As the enterprise mobility team, we manage over 100 different mobile apps at any given time. This includes volume purchase apps, consumer versions of apps listed in our MDM, and custom-developed apps. In my last post about Relay, our custom real-time chat application, we have seven different components that need to be managed and maintained for this single app (iOS, Android, Web, macOS, Linux, Windows, and Server). A good majority of our custom apps are similar, and have multiple components, all of which have independent release cycles and potentially different teams that manage them. We initially used an excel spreadsheet to track and manage these applications and their corresponding components. This became a logistical challenge as our portfolio and responsibilities grew. Our commitment to our end users also grew during this time, and we wanted to provide a consistent support experience across operating systems and apps. We took this opportunity to step back and look at the process holistically, and decided to redesign how we managed and supported apps that we were responsible for. We also defined some essential services and features each of the apps should have, independent of their platform. I touched on this in a previous blog, but from a support perspective each app should include:read more
Late last year I wrote a small paper (for my MBA program) and developed an accompanying proof of concept (Javascript/Node/P2P) on the implementation of blockchain in the retail or food distribution network around protecting goods from food fraud.
Food fraud is a crime which has the
potential to negatively affect the brand image, financial resources and impact
multiple parties in the supply chain paradigm of food distribution. The ability
to track and trace the origin and touch points of products throughout the
network is imperative to limit the impact caused by a food fraud incident or a
food safety issue. Blockchain has the potential to disrupt multiple industries
by providing a shared and trusted ledger of transactions which no single
company controls. One practical application of blockchain is utilizing the
platform as a static register – a distributed database for storing reference
data. In this paper I will describe a technical implementation of a blockchain
in a practical scenario which shares the details and a proof of concept of a
food origin scenario. The implementation will share a simplistic JavaScript application
of a digital ledger based blockchain allowing manufacturers to register data on
the food origin in the static registry and vested parties the ability to augment
and view the data for the purpose of traceability and accuracy.read more
Rasa is an open source machine learning framework to automate text-and voice-based conversations.
Rasa UI is a web application built on top of, and for Rasa. Rasa UI provides a web application to quickly and easily be able to create and manage bots, NLU components (Regex, Examples, Entities, Intents, etc.) and Core components (Stories, Actions, Responses, etc.) through a web interface. It also provides some convenience features for Rasa, like training and loading your models, monitoring usage or viewing logs.
I developed Rasa UI to help me manage my bots as well as creating and managing the training data. The app is developed on NodeJS, and uses a simple SQLite DB for persistence (previously PostgresDB). read more
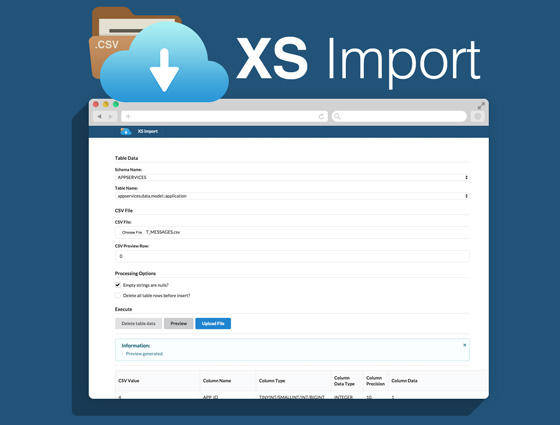
During a recent small migration project from a HCP MaxDB DB to a HCP HANA DB I needed to import multiple CSV files, and go through a series of dry runs during the process. Since I was going to be doing the loads multiple times, I decided it would be helpful to write a small front end to make the processes of uploading failrly large CSV files into HANA simpler.
Over the past few months I have heard the question: “Whats the best way to get data into HANA from CSV?” While there are a few options if you have a HANA appliance and system level access to the system, there are not too many options with a HCP instance. After trying/testing the CSV import from Studio (size limit), a hdbti file (not great for multiple/repetitive options/file size challenges) it does not leave you with too many choices. After doing some digging it seems quite a few people have uploaded data through a server side script (XSJS) successfully and using the BATCH option while processing is pretty fast.read more
You must be logged in to post a comment.