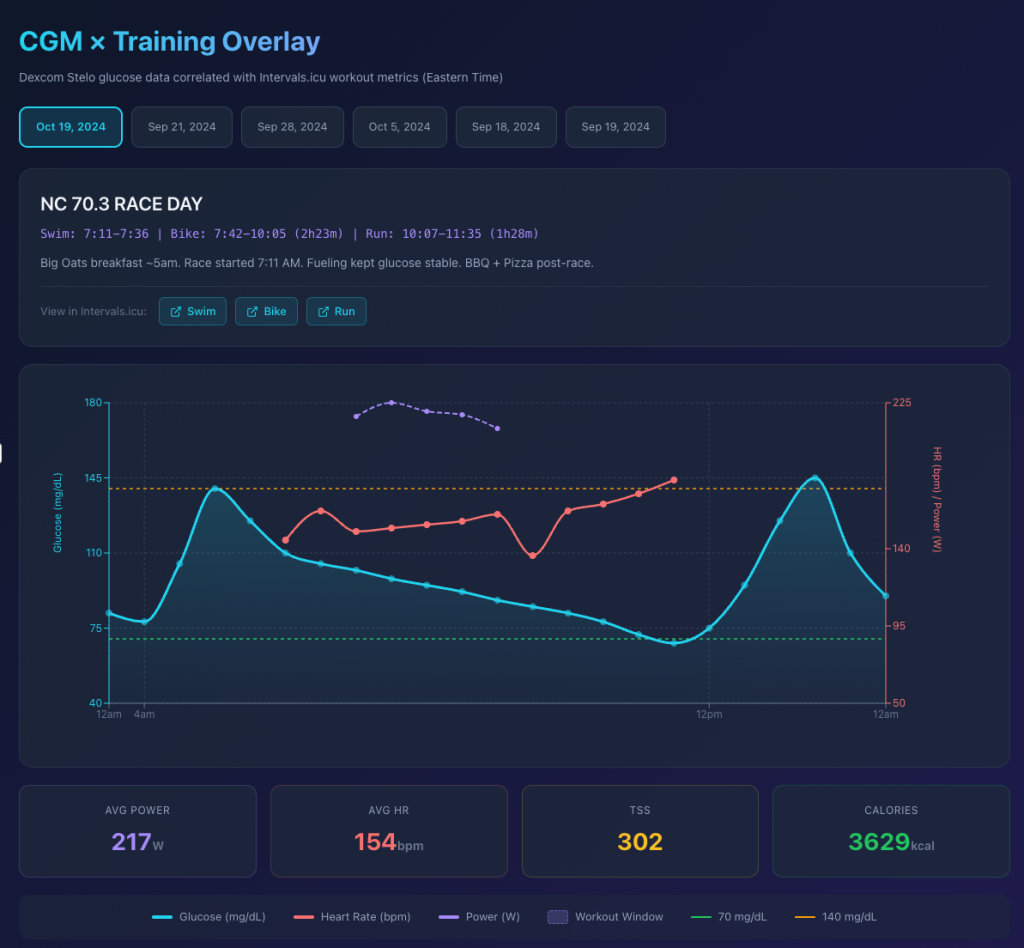
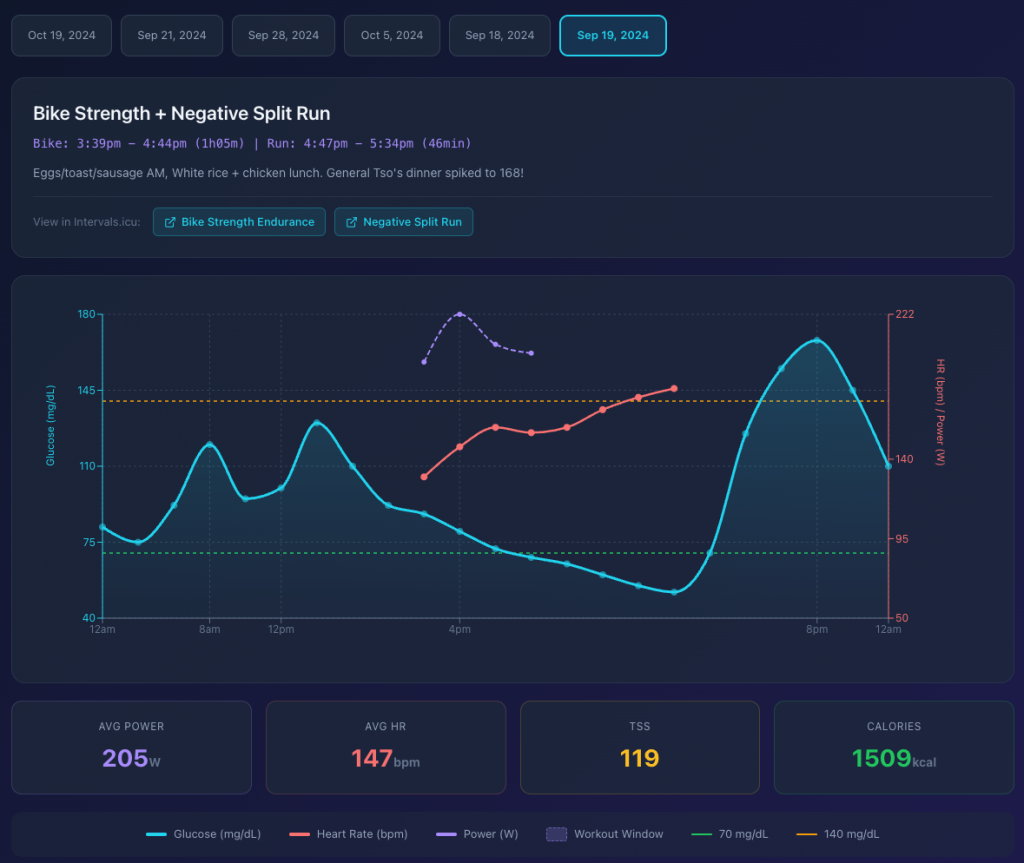
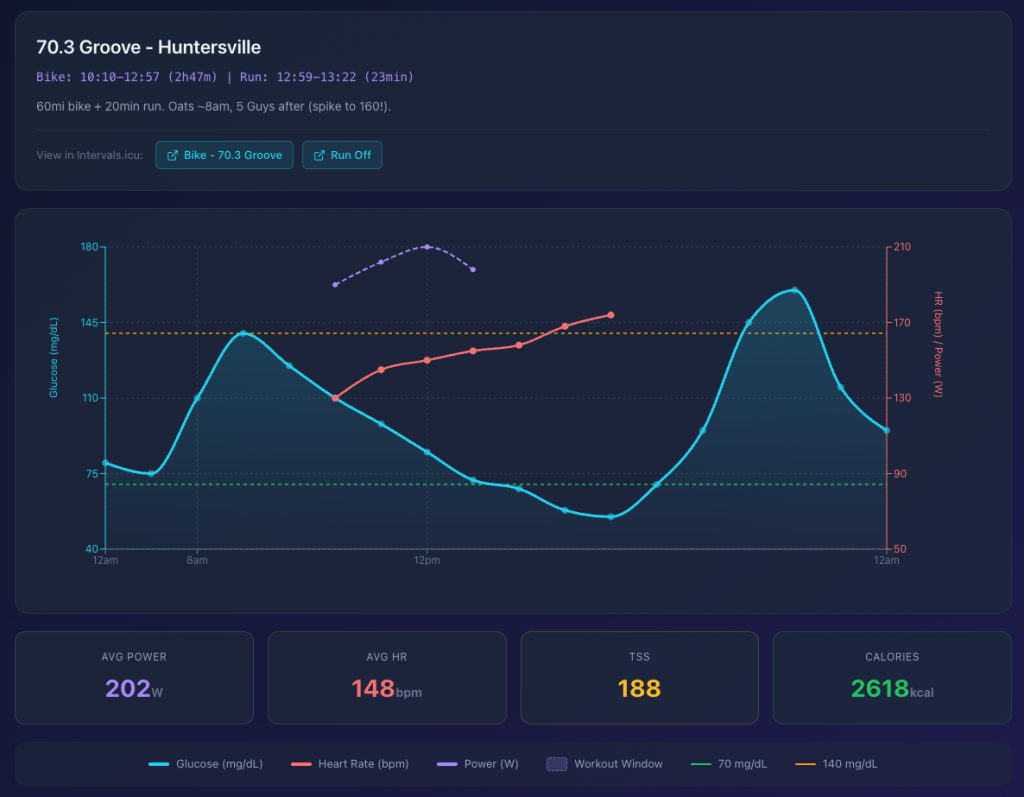
Some interesting insights from overlaying Glucose levels (from Stelo) with exercise duration/intensity.
Generated by Claude.
Personal collective of ideas, thoughts and notes
Some interesting insights from overlaying Glucose levels (from Stelo) with exercise duration/intensity.
Generated by Claude.
I got tired of being locked into FitIndex’s ecosystem when I wanted to move my weight tracking data to Garmin Connect. Their CSV export format doesn’t play nicely with other platforms, so I built (Thanks Claude Code!) a simple Node.js converter that transforms FitIndex exports into Fitbit’s CSV format (which most fitness platforms actually support). It handles the timestamp conversion, cleans up the data, and spits out a file you can import anywhere. Nothing fancy, just solves the annoying problem of data portability between fitness apps.
GitHub – paschmann/FitIndexToFitBit: Small Node.js application which converts FitIndex export files (CSV) to FitBit files which can then be uploaded to Garmin Connect.
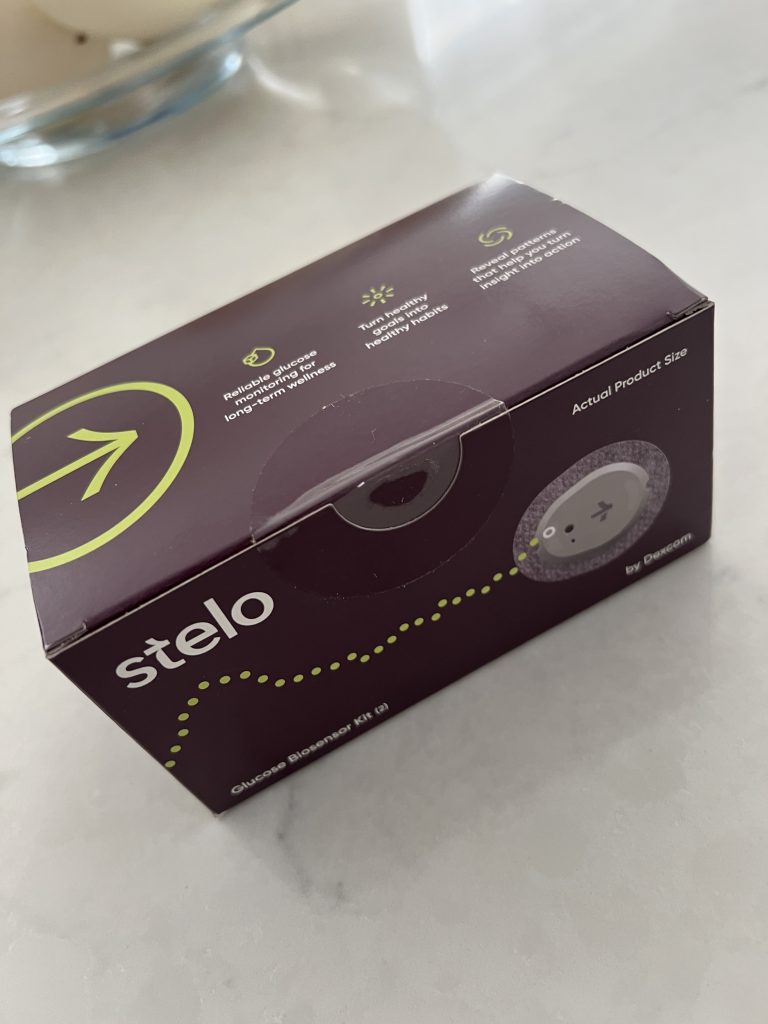
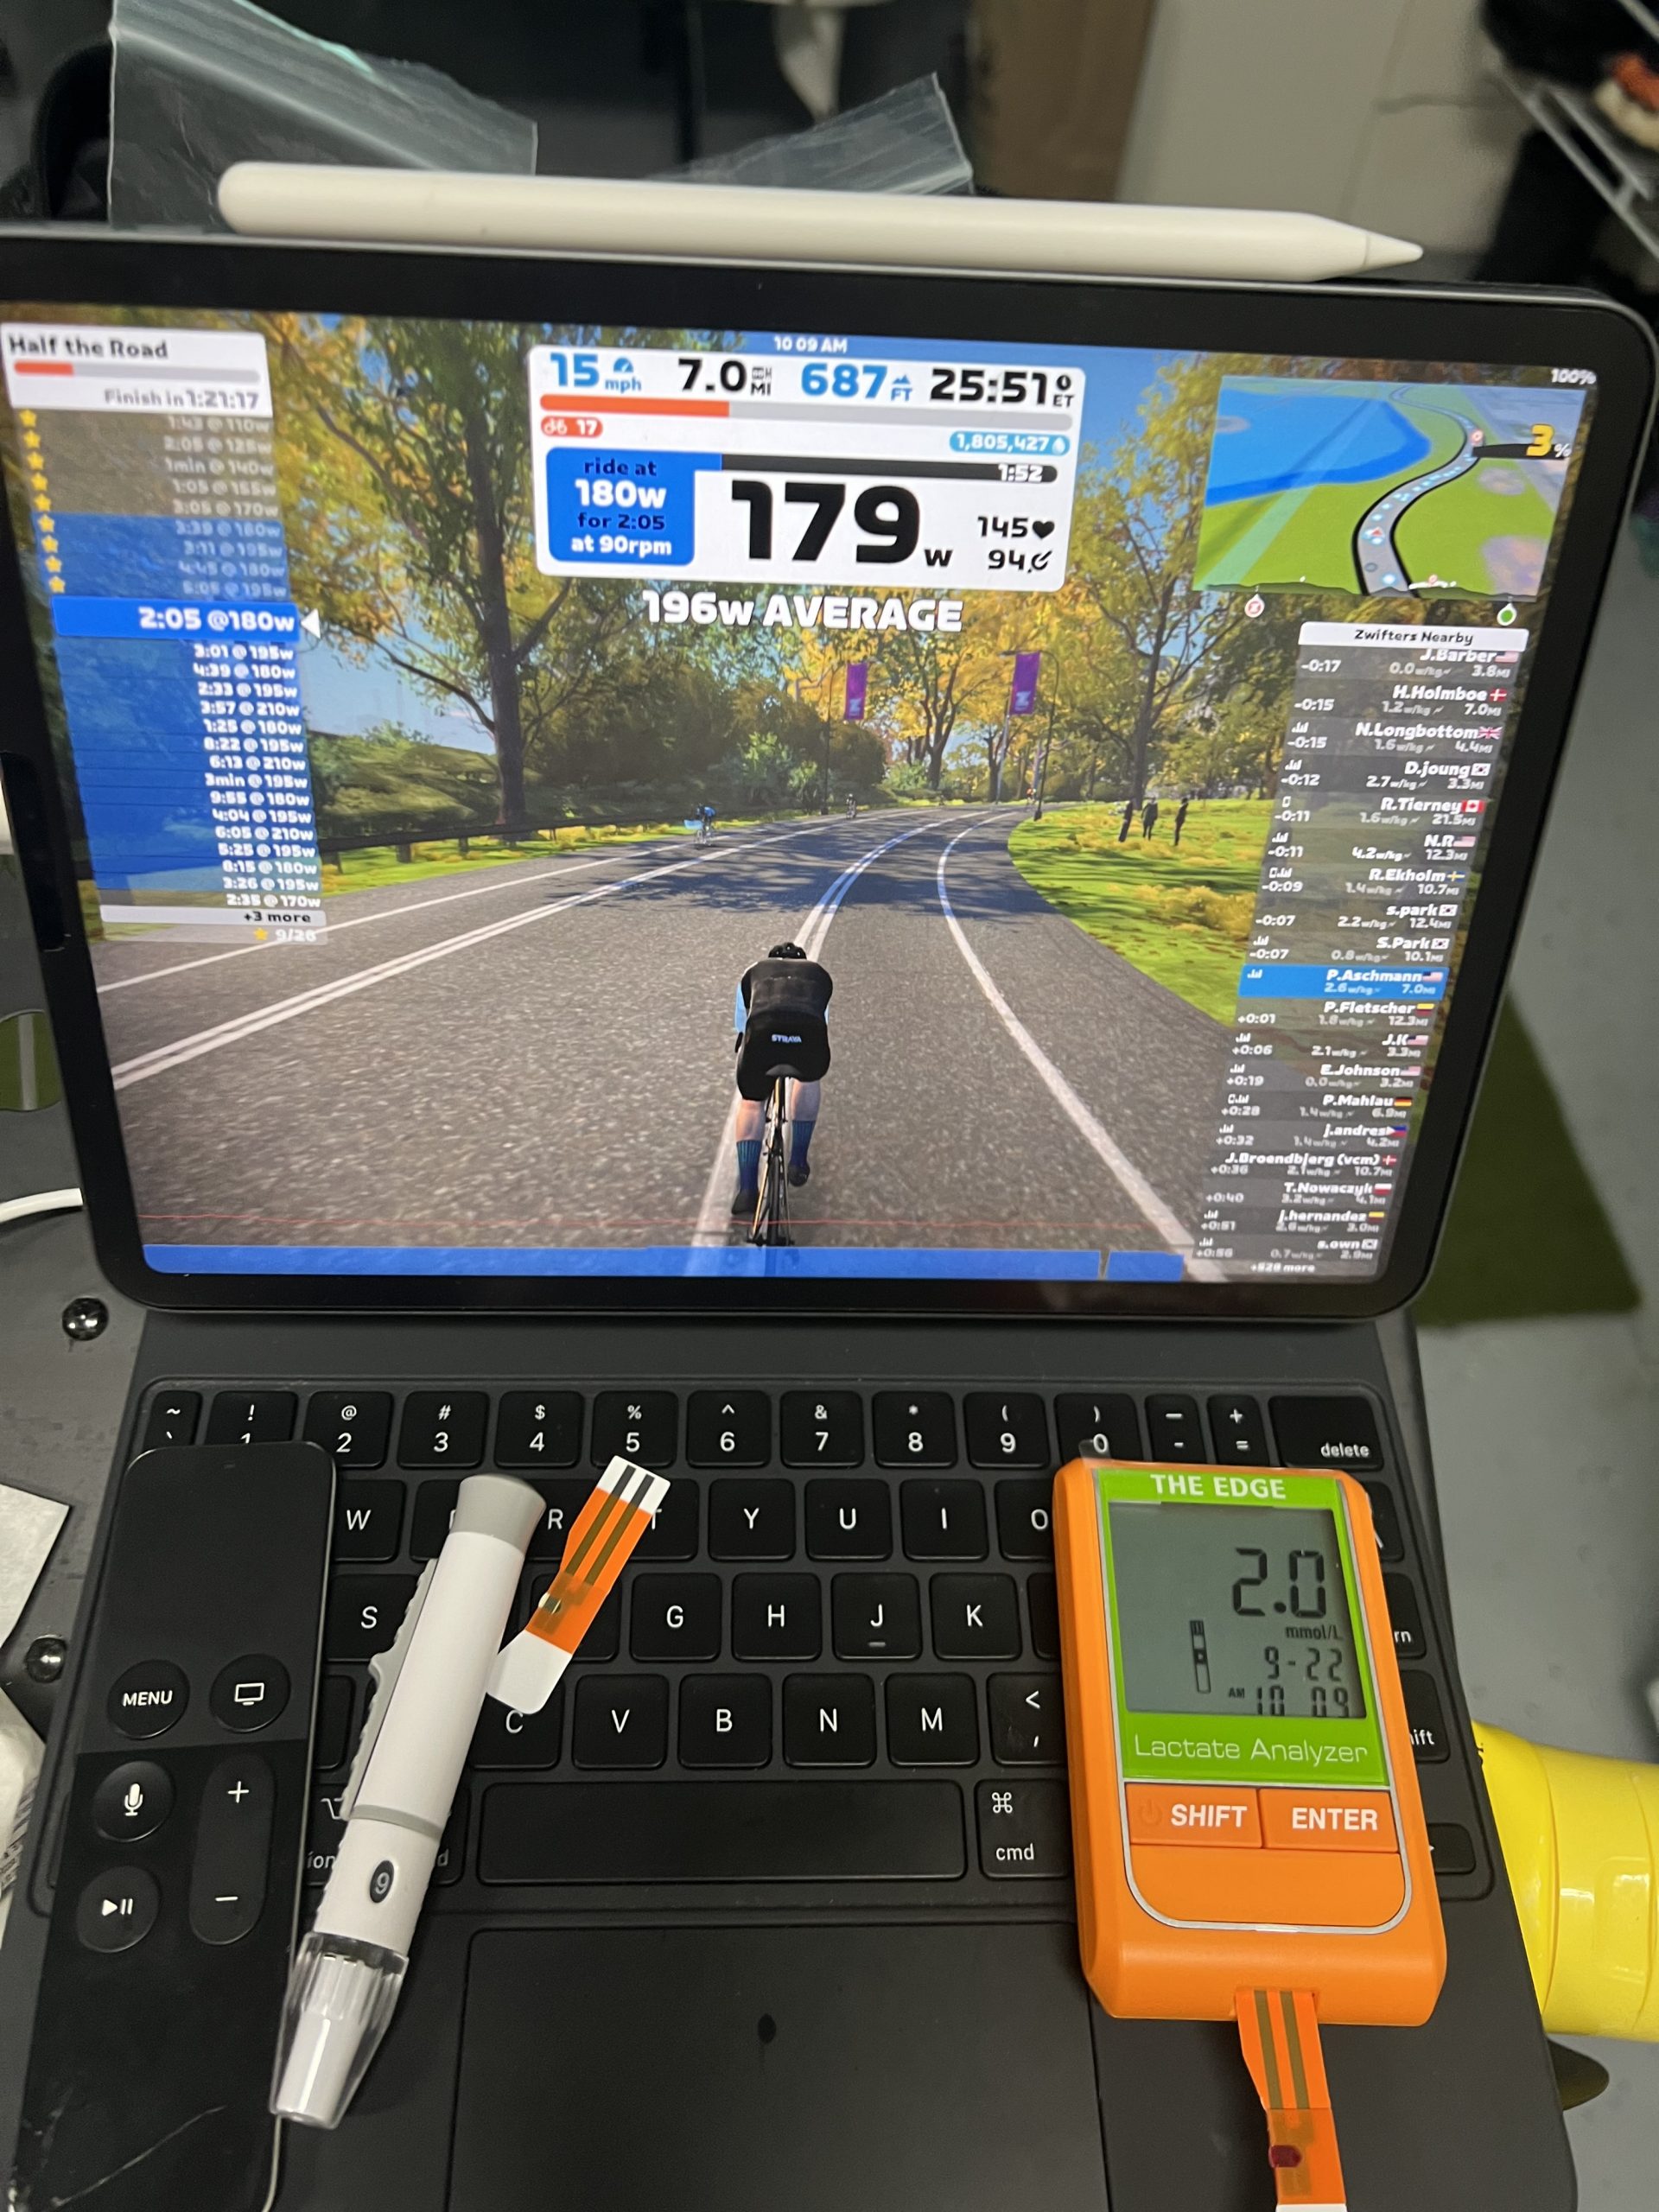
I have been on the waiting list for Stelos early access program and was pleasantly surprised to see an email pop into my inbox suggesting I could order one 🙂
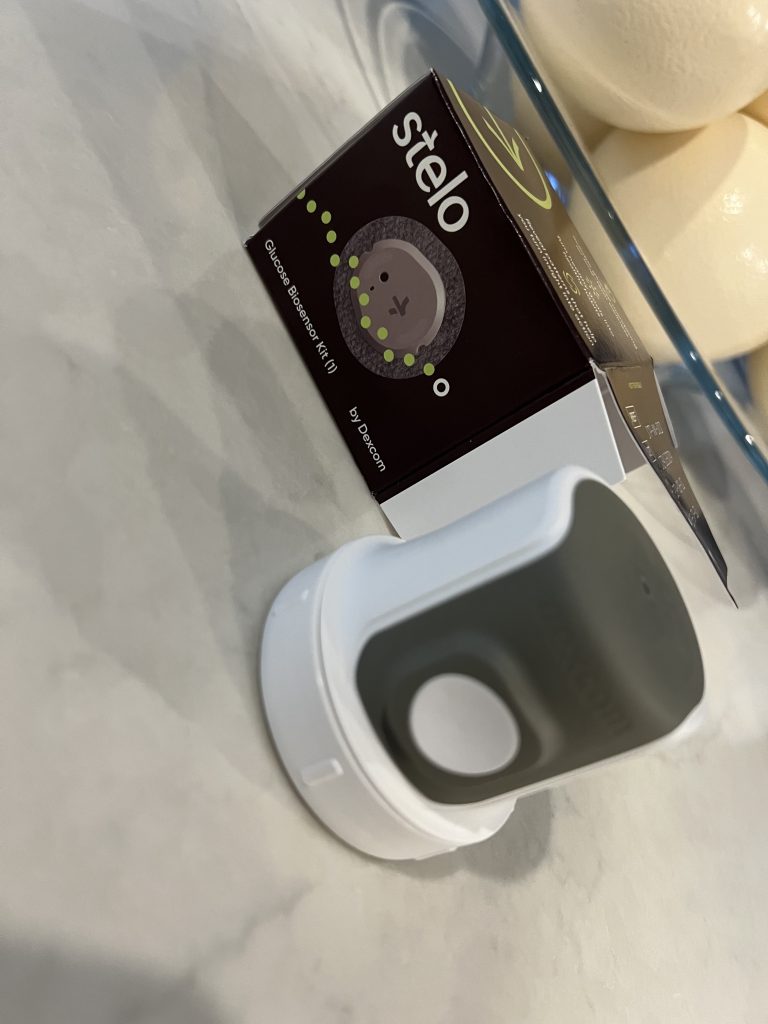
I spent roughly 3 months collecting data, doing workouts, monitoring my blood glucose levels, but like many of my data focused gadgets, it ended in with some unique insights about my health, but also nothing ground breaking or earth shattering. I did use it during a 70.3 Race, lots of tough training sessions and I was hoping to identify some weaknesses and low points which would correlate with low energy or fatigue but that did not seem to materialize.
Ultimately what I am learning is that the human body is extremely complicated, there are a handful of reasons why we feel the way we do which we can measure, but probably millions of others, which we can’t. It always seems to bring me back to the mantra of “Correlation does not equal causation”.
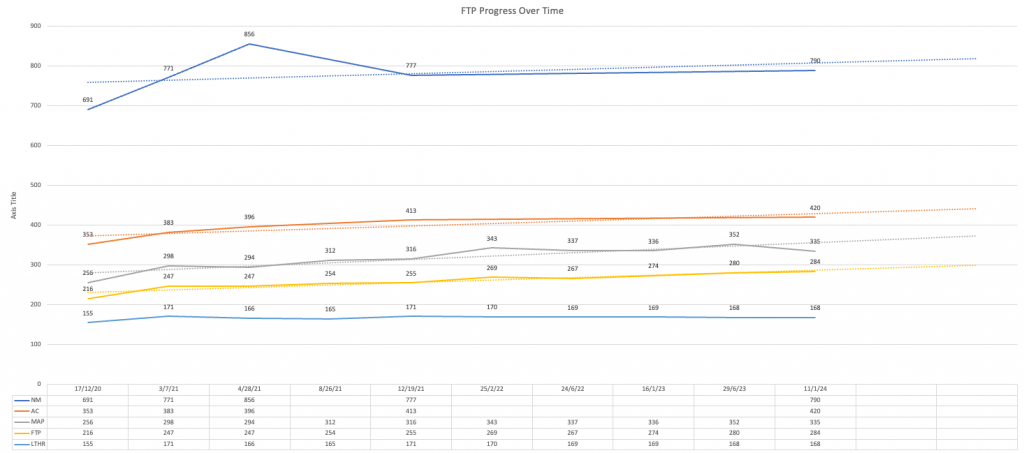
Tracking cycling endurance training progress over time. As I have shifted my focus from MTB racing to Endurance/long distance triathlon, My sprint power has decreased slightly (5 minutes and 1 minute) but FTP (20 min+) has slowly been ticking upward. Since I have been swimming and running more, it probably has not increased as much as I hoped, but I am learning endurance is not something that gets established overnight ….
Super interesting article on the use of Hypoxanthine (from sweat) being used as a predictor of performance in athletes.
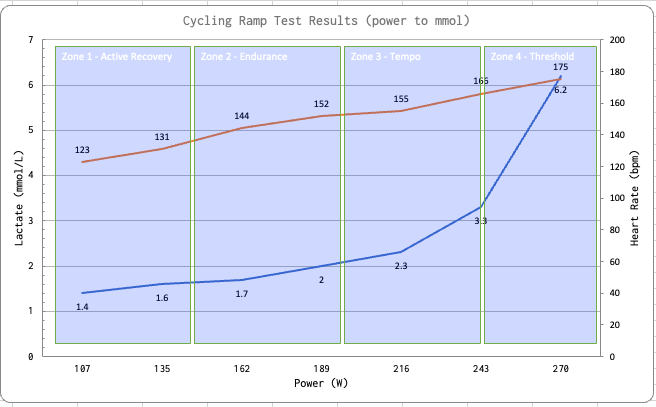
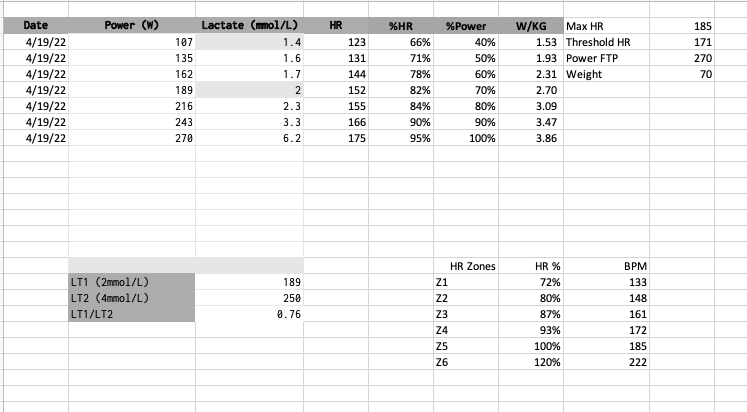
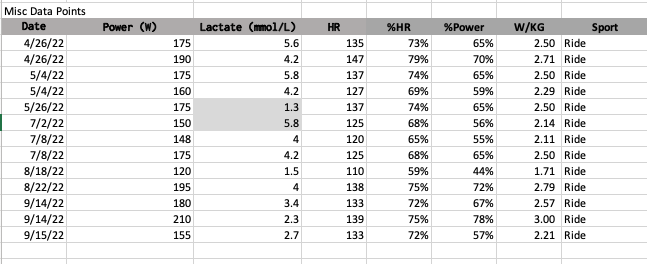
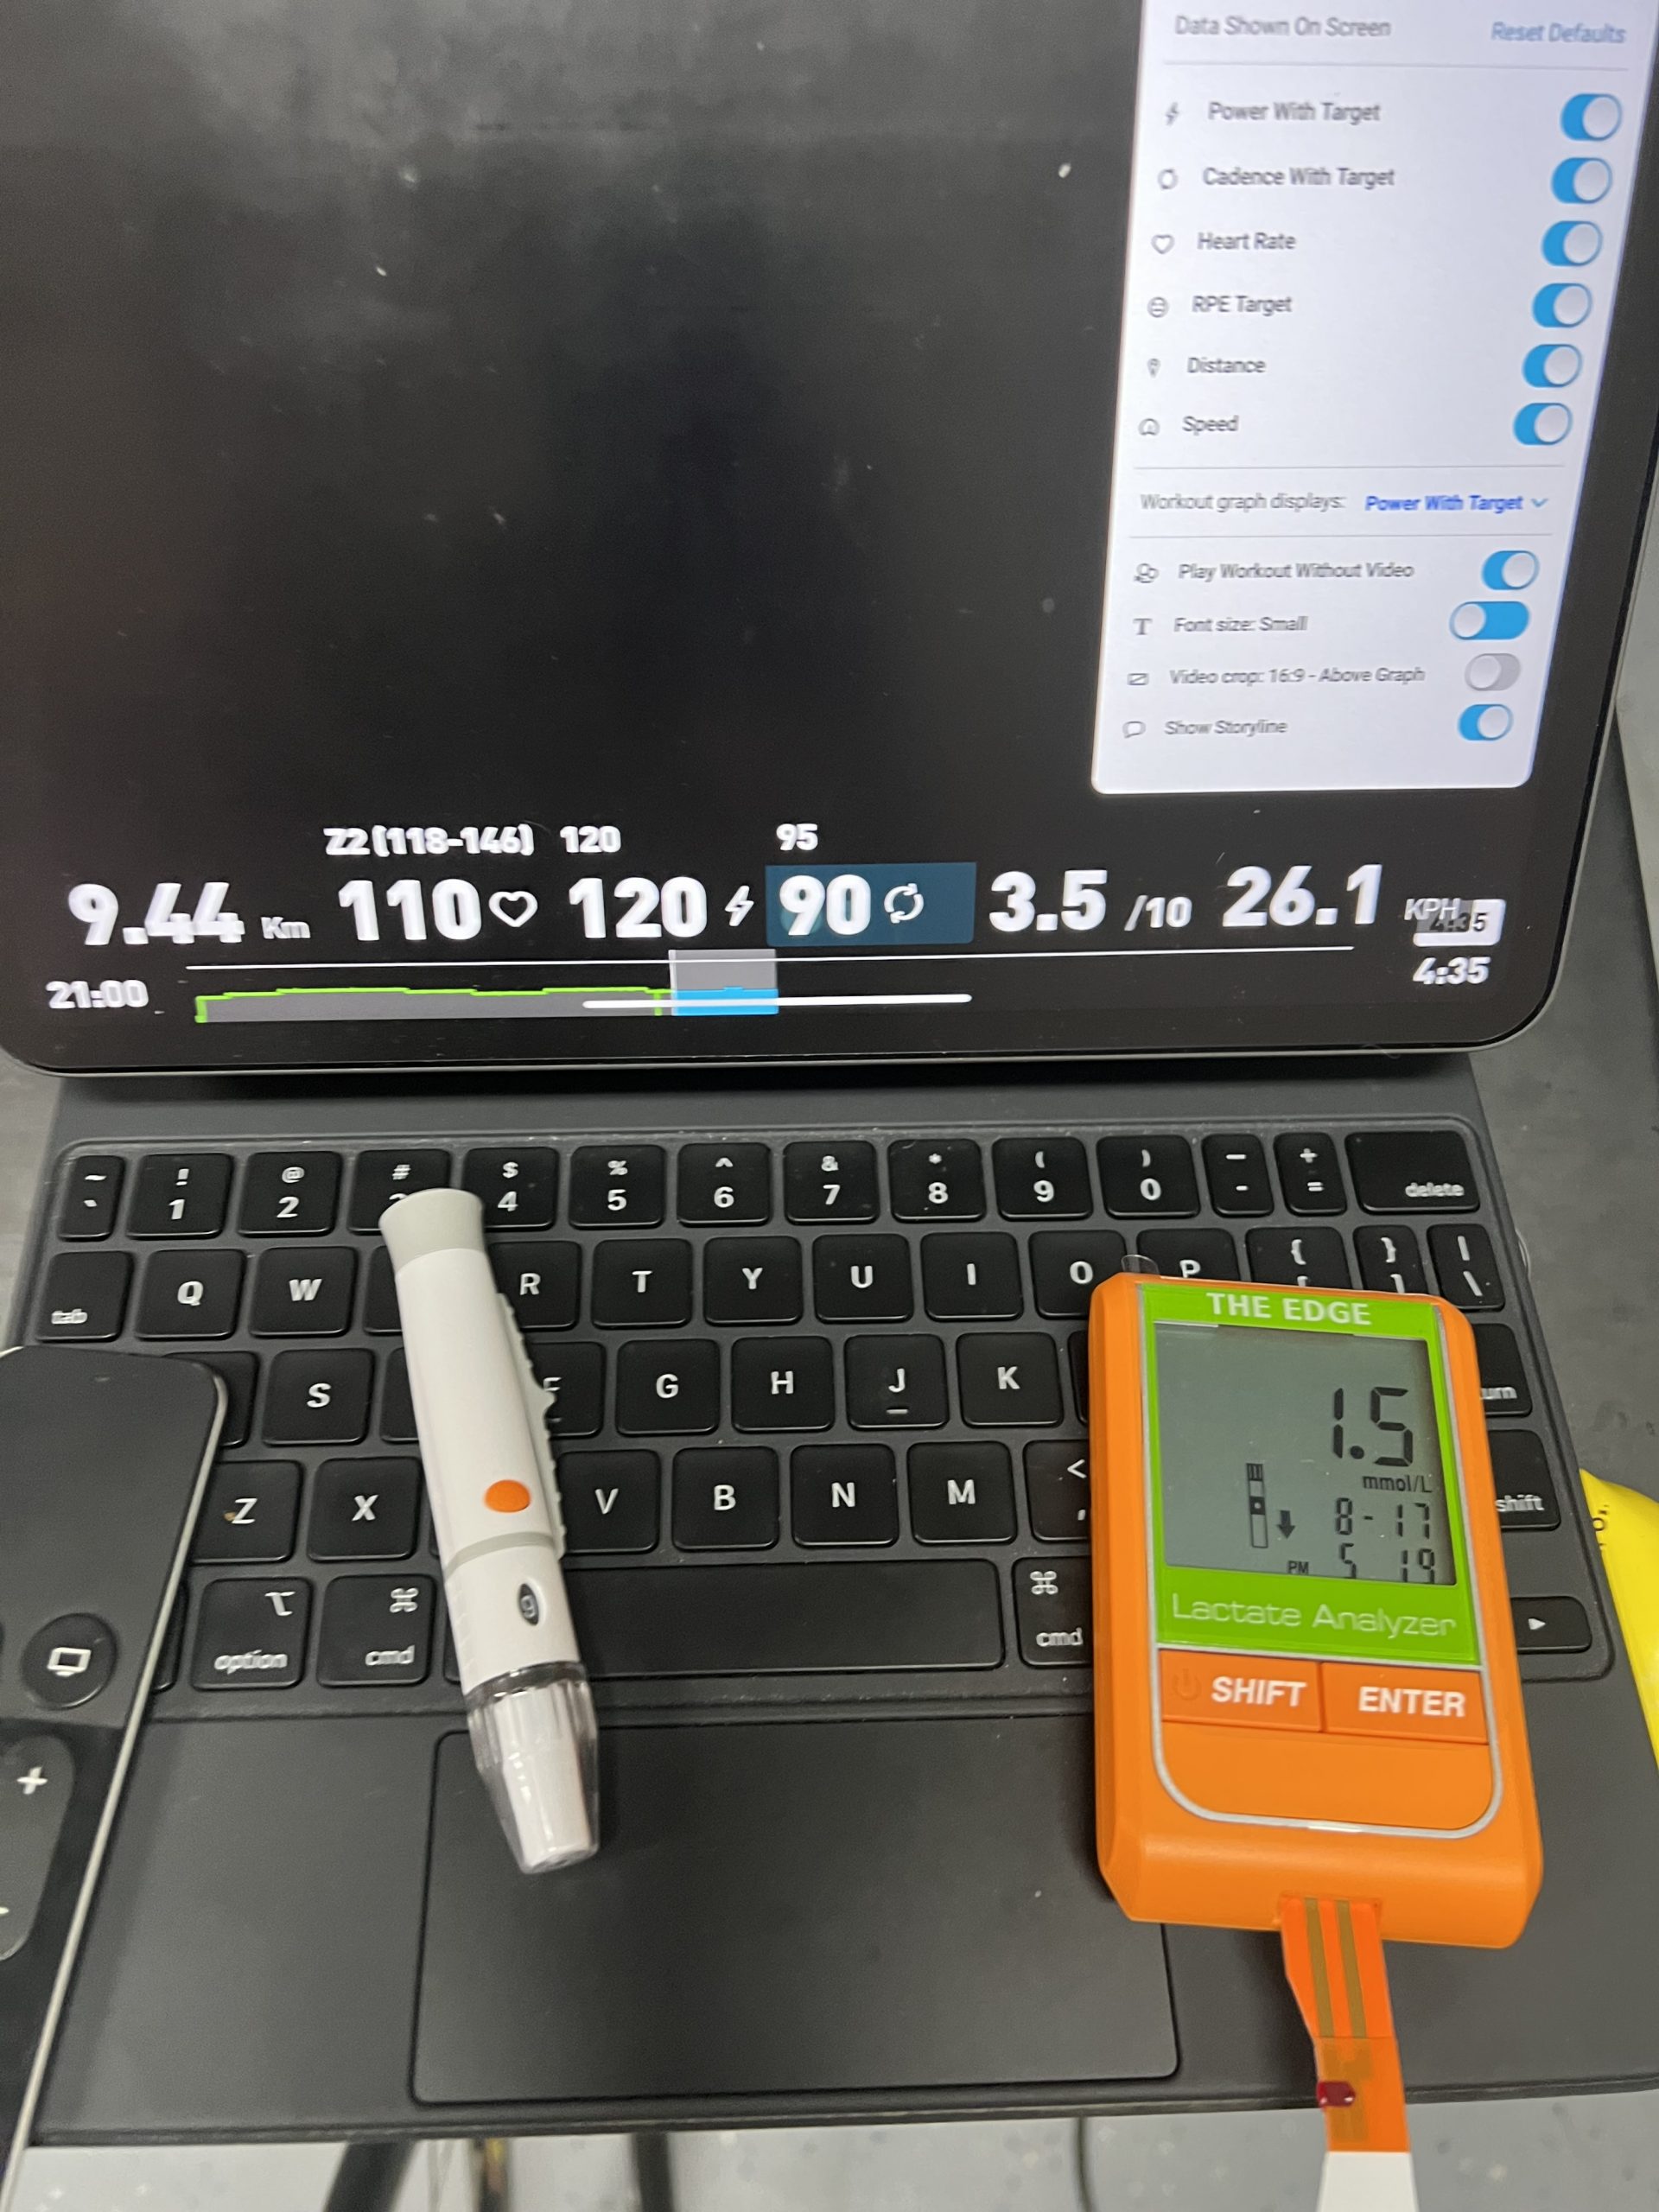
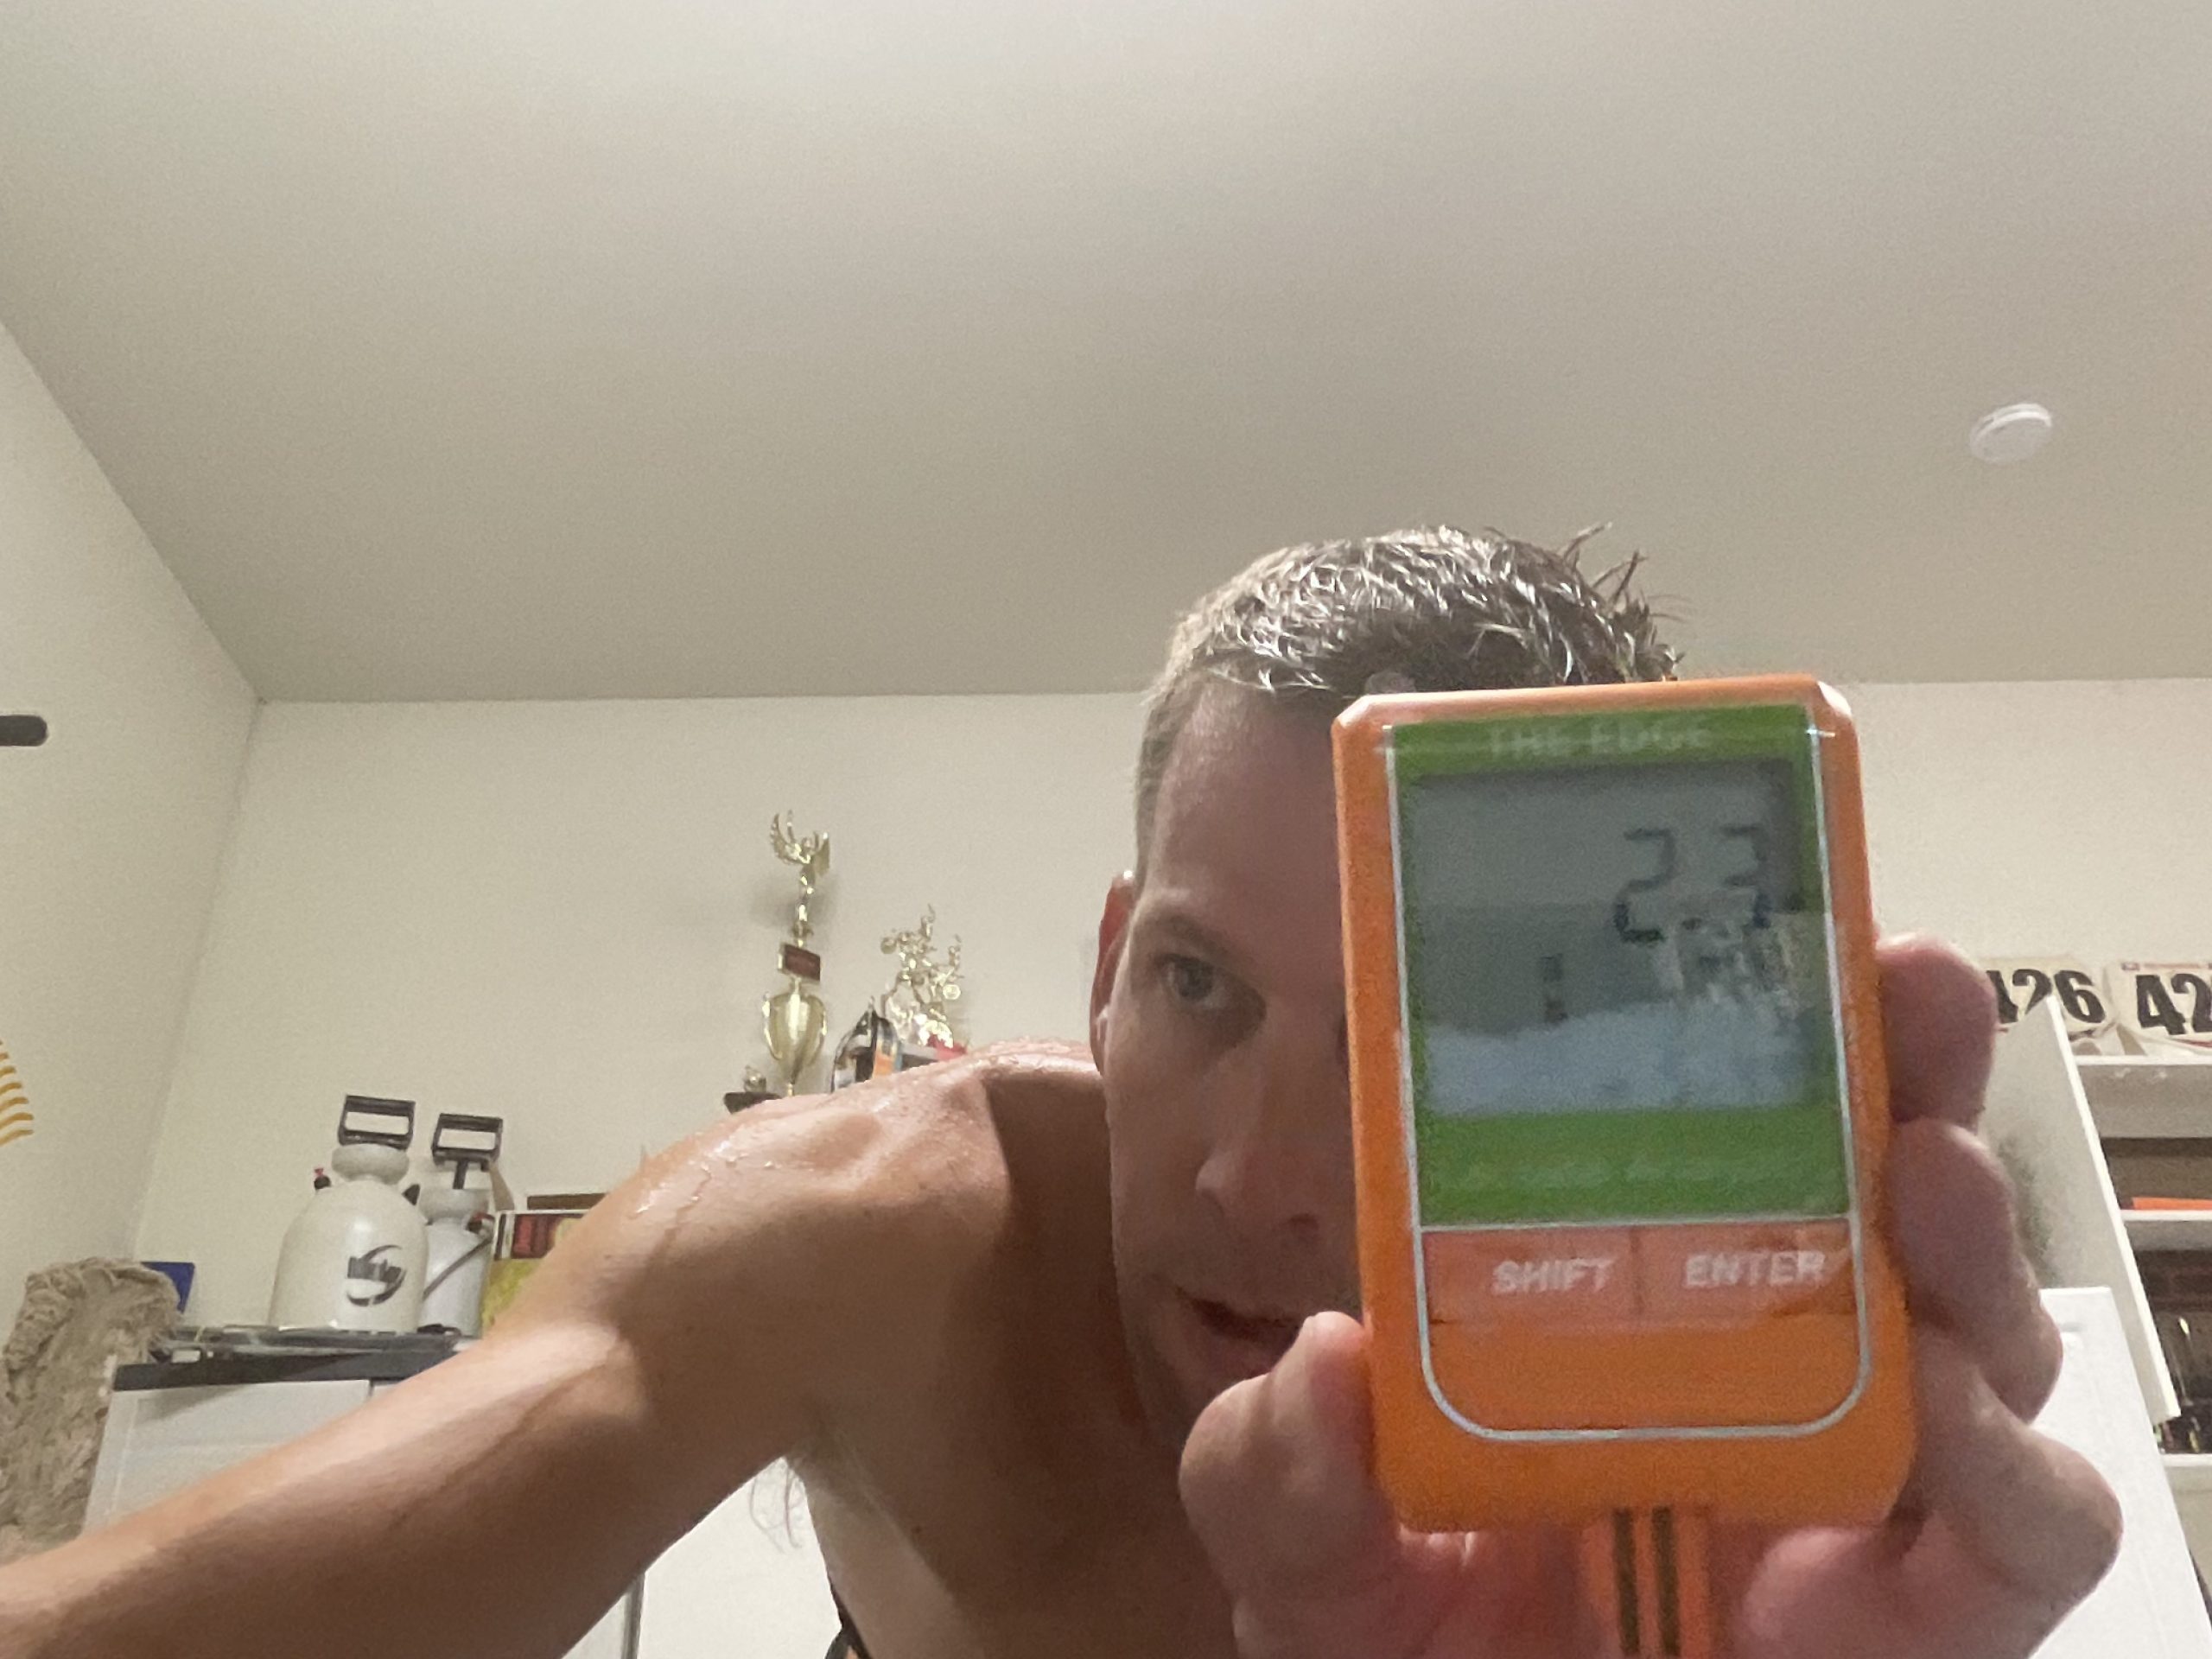
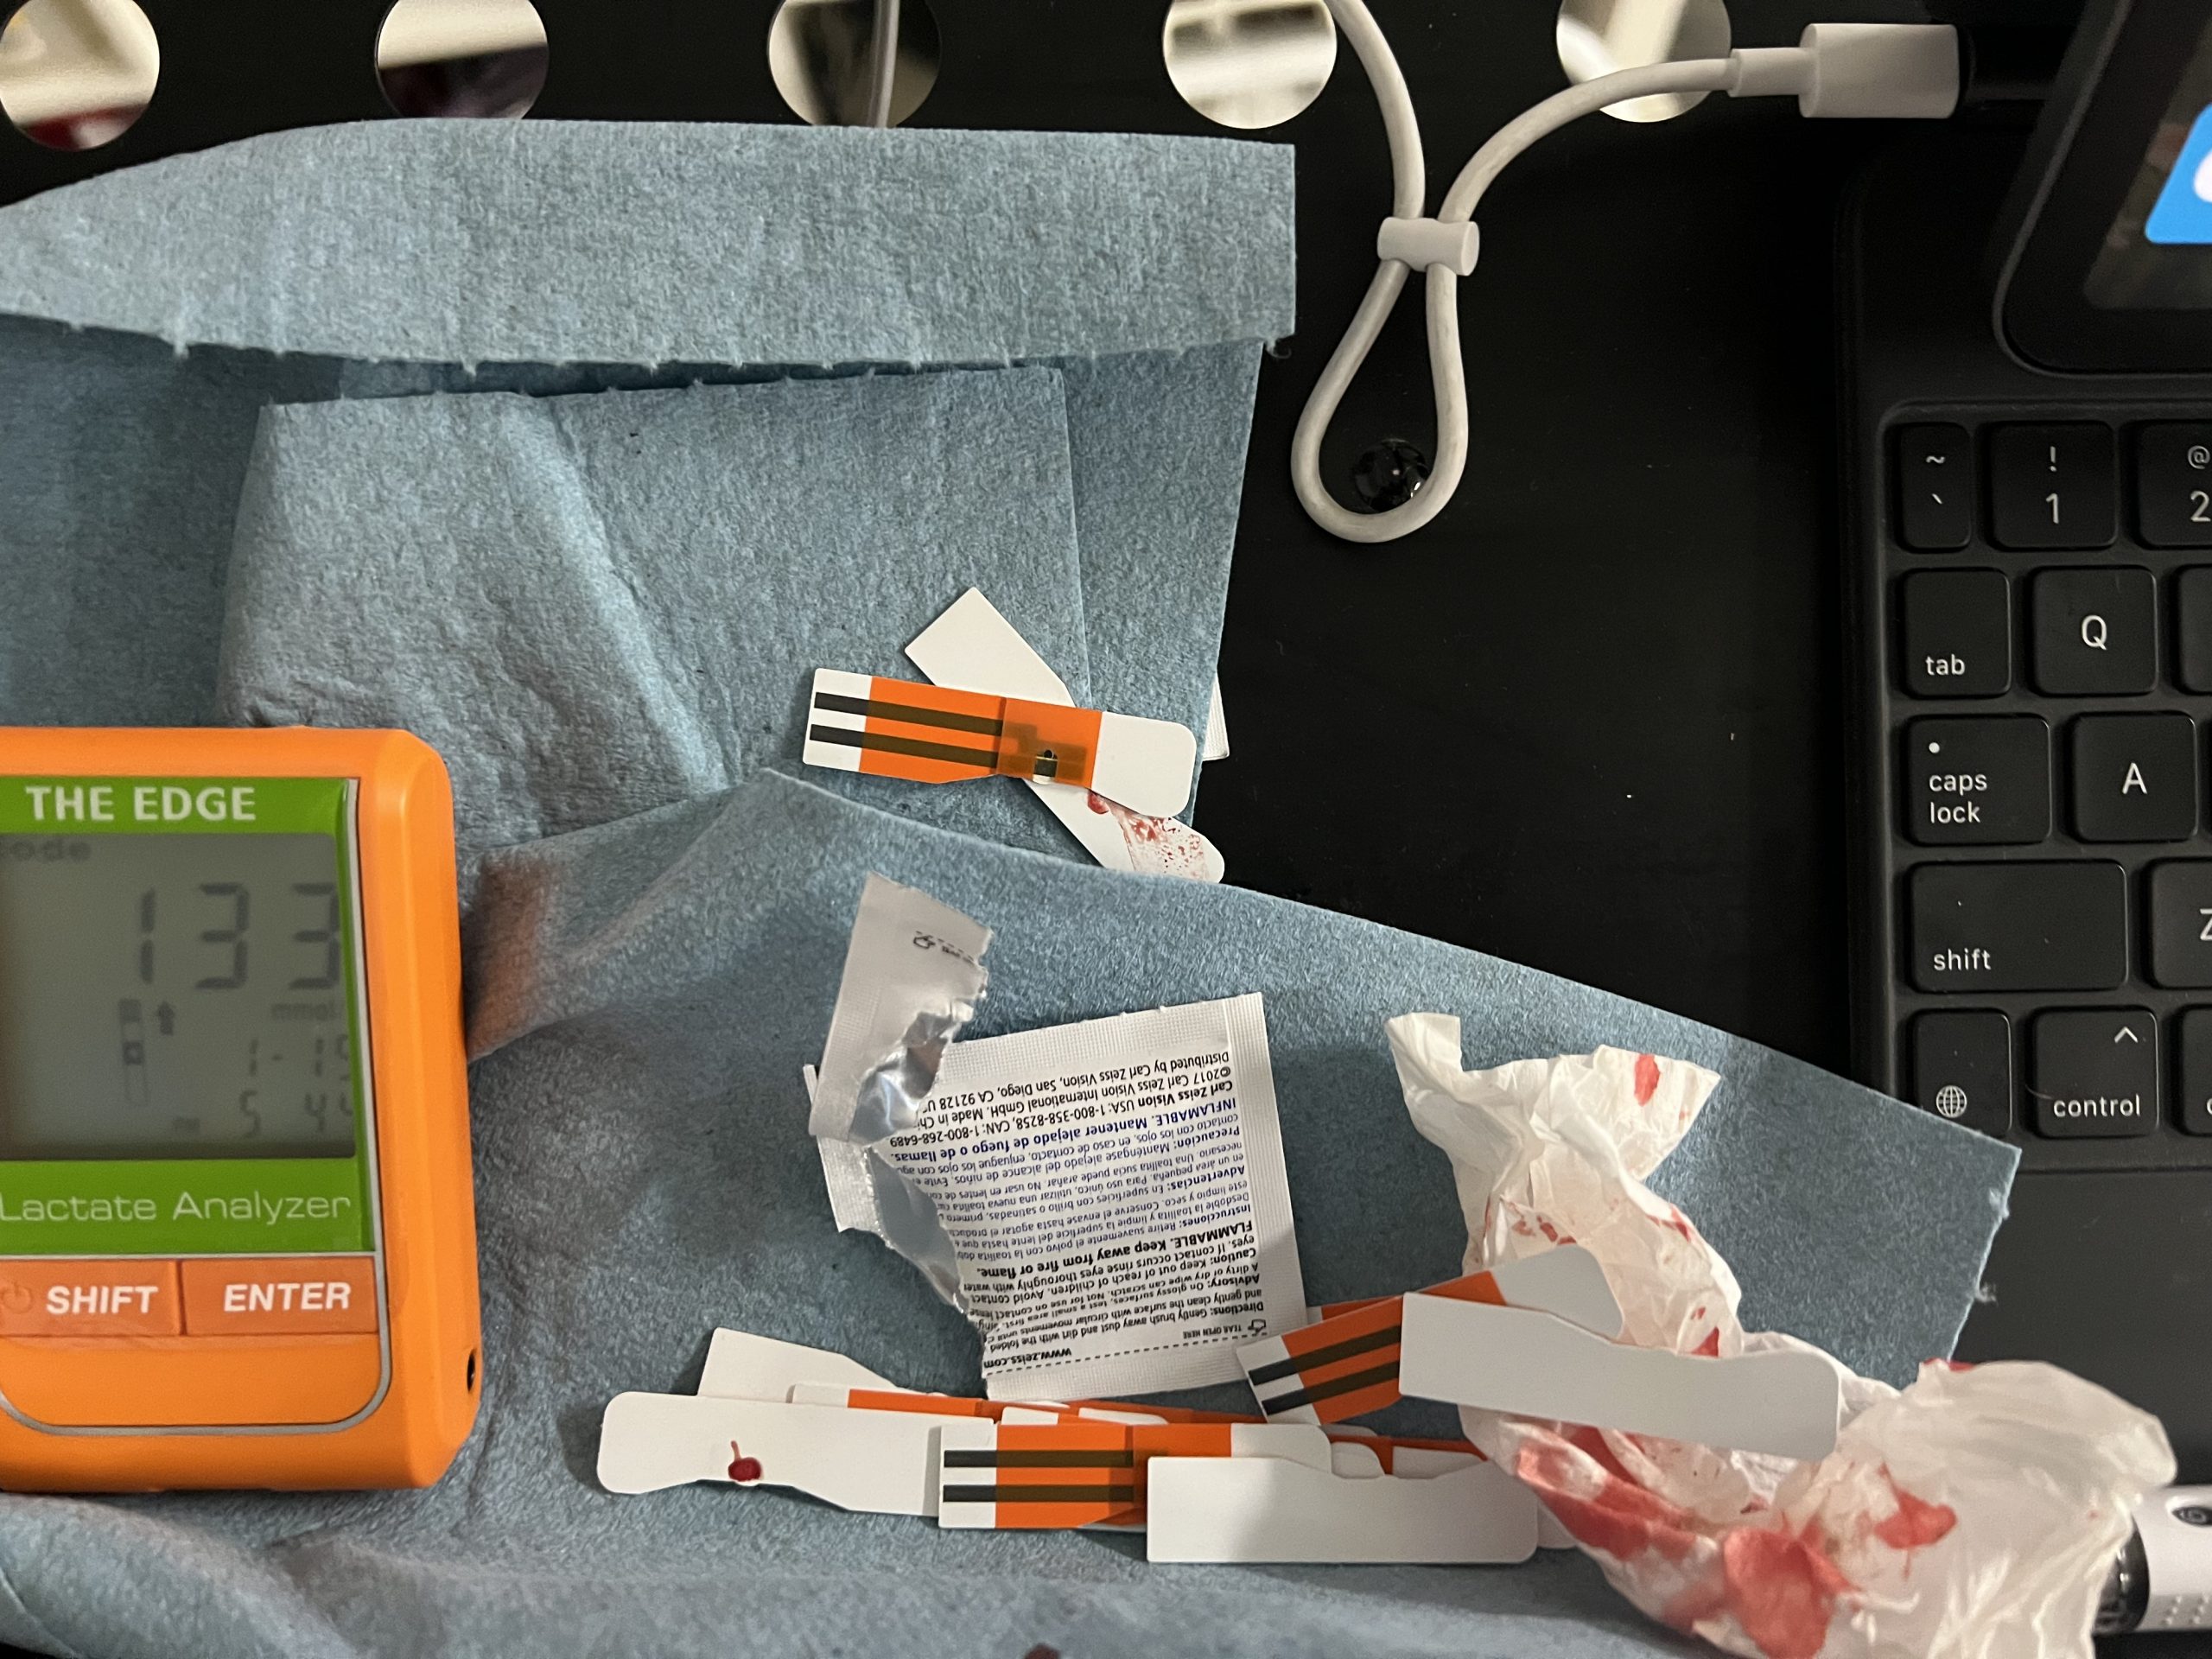
Having done HR tracking, Power and over the last couple of years, Lactate, it’s always interesting to hear of new methods and advancements in performance, and opportunities to improve metabolic health. So while I am still waiting for a reasonable/practical real-time Lactate monitoring solution, maybe I should skip to the next big thing …
Check it out here: https://pubmed.ncbi.nlm.nih.gov/23670363/
Purine metabolism reflects the exercise-induced muscle adaptations and training status. This study evaluated the utility of plasma hypoxanthine in the prediction of actual sport performance. We studied male athletes: 28 triathletes (21.4±2.9 years), 12 long-distance runners (23.2±1.9 years), 13 middle-distance runners (22.9±1.8 years) and 18 sprinters (22.0±2.7 years). Season-best race times were considered, achieved over standard triathlon, 5 000 m, 1 500 m and 100 m, respectively. Incremental treadmill test was administered to determine maximum and “threshold” oxygen uptake. Resting and post-exercise plasma concentrations of hypoxanthine, xanthine, uric acid and lactate were measured as well as resting erythrocyte hypoxanthine-guanine phosphoribosyltransferase activity. Simple and multiple regression analyses were used to identify significant contributors to the variance in performance. Hypoxanthine considered alone explained more variance in triathletes, long-distance runners, middle-distance runners and sprinters (r 2=0.81, 0.81, 0.88 and 0.78, respectively) than models based on aerobic capacity and lactate (R 2=0.51, 0.37, 0.59 and 0.31, respectively). Combining purine metabolites and cardiorespiratory variables resulted in the best prediction (R 2=0.86, 0.93, 0.93 and 0.91; r=0.93, 0.96, 0.96 and 0.95, respectively). In summary, hypoxanthine is a strong predictor of performance in highly trained athletes and its prediction ability is very high regardless of sport specialization, spanning the continuum from speed-power to endurance disciplines.
Sweat, and specifically Sodium, is one of the three “levers” for endurance athletes when it comes to hydration and nutrition (fueling) and subsequently your performance. The other two key elements or levers are Carbohydrates and Fluids.
The most important part about sodium/sweat is that everyone has a unique sweat loss rate, and a unique sodium content ratio in their sweat. So while a more generalized approach can be defined for consuming carbohydrates, the same is not true for electrolyte loss. This is why having a sweat test is critical for athletes wanting to perform, understand and take advantage of their data to understand their personal needs and requirements.
How to perform a DIY Test: https://www.youtube.com/watch?v=MYA8gzF9Zd8
Do not perform a test if you base (i.e. before exercising) is greater than ~ 1.8 mmol/L. Spin easy for 15 mins and try to get it down before starting the ramp test. Otherwise, don’t waste the test strips.
You must be logged in to post a comment.