3 minutes slower than in 2022 🙂


Personal collective of ideas, thoughts and notes
3 minutes slower than in 2022 🙂
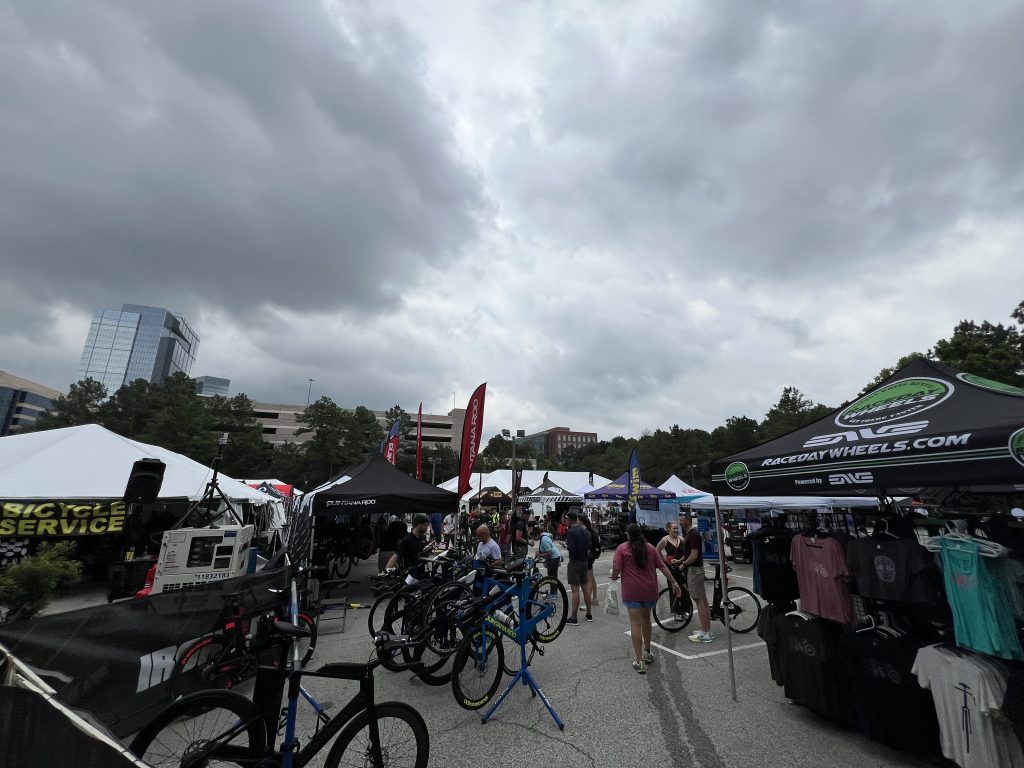
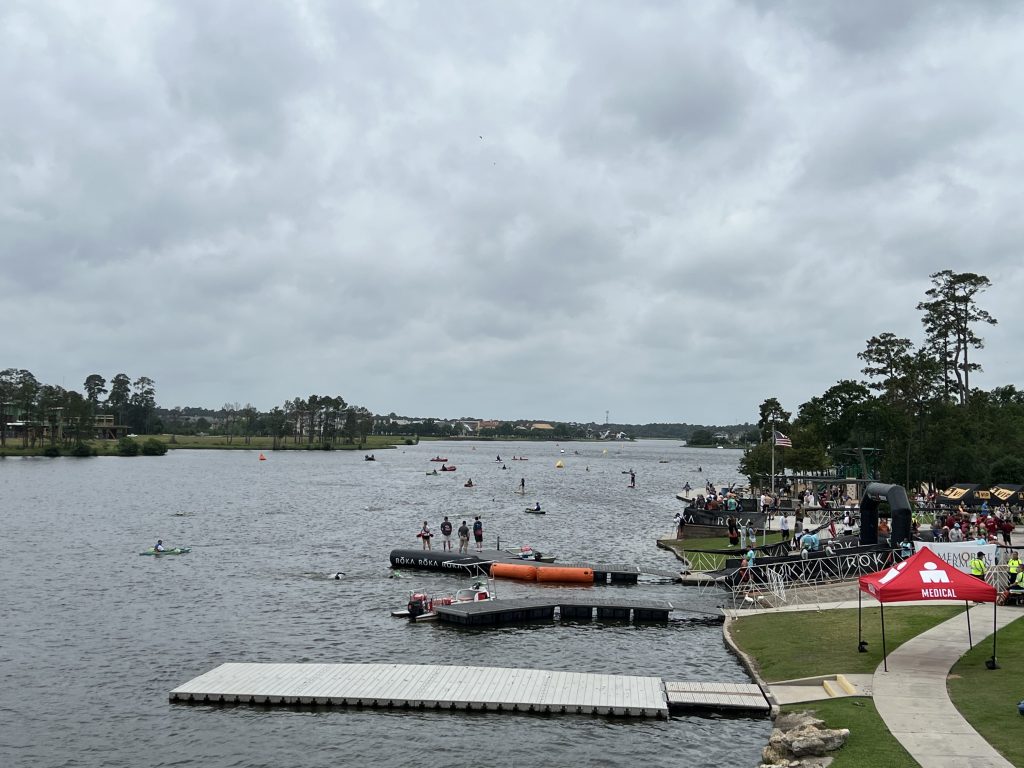
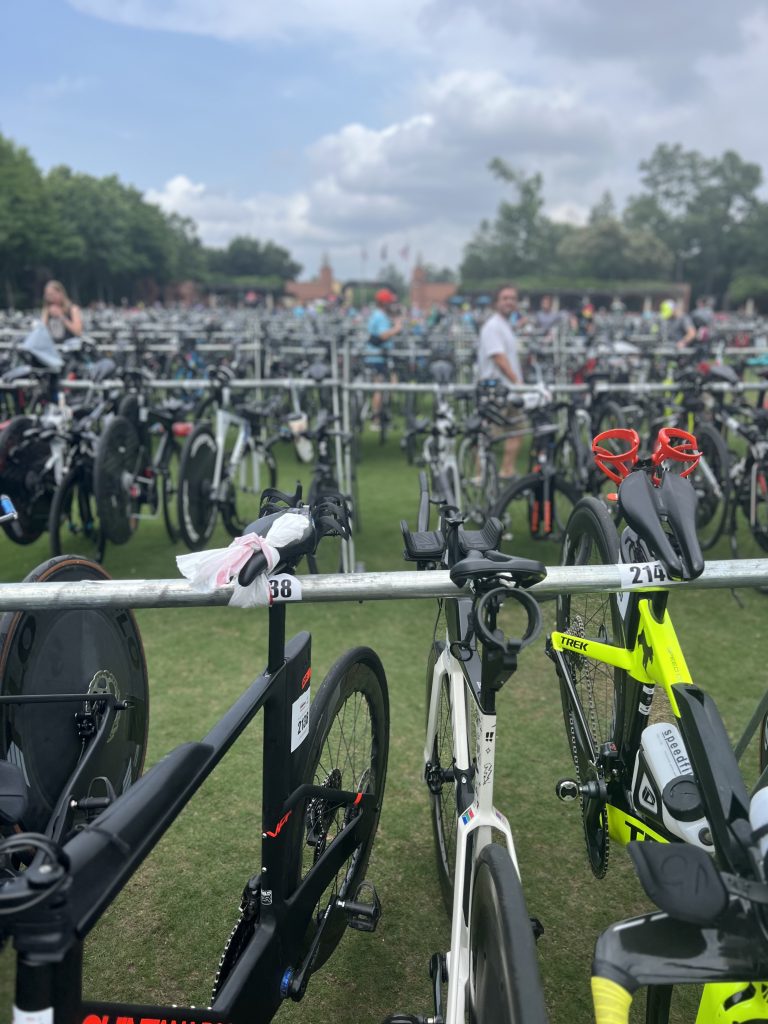
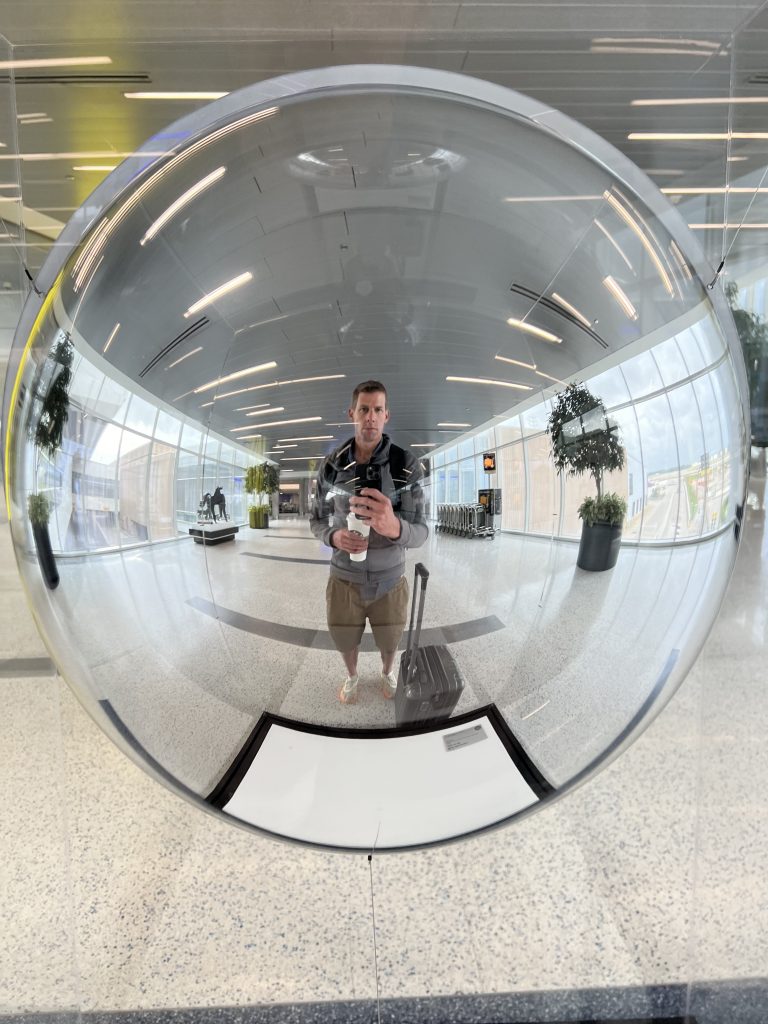


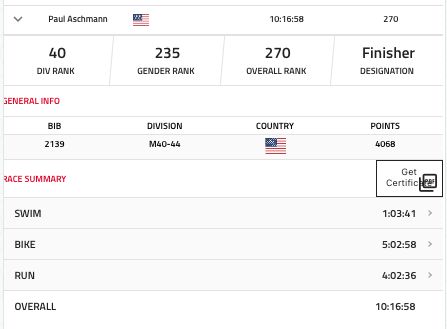
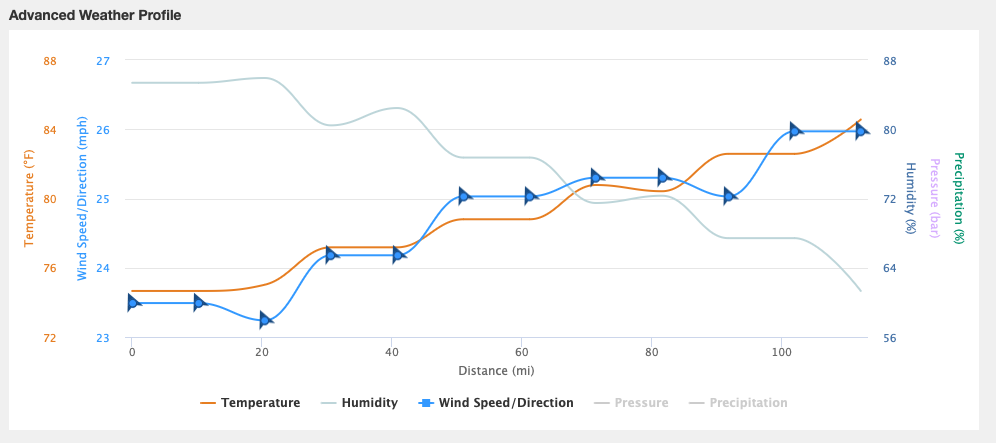
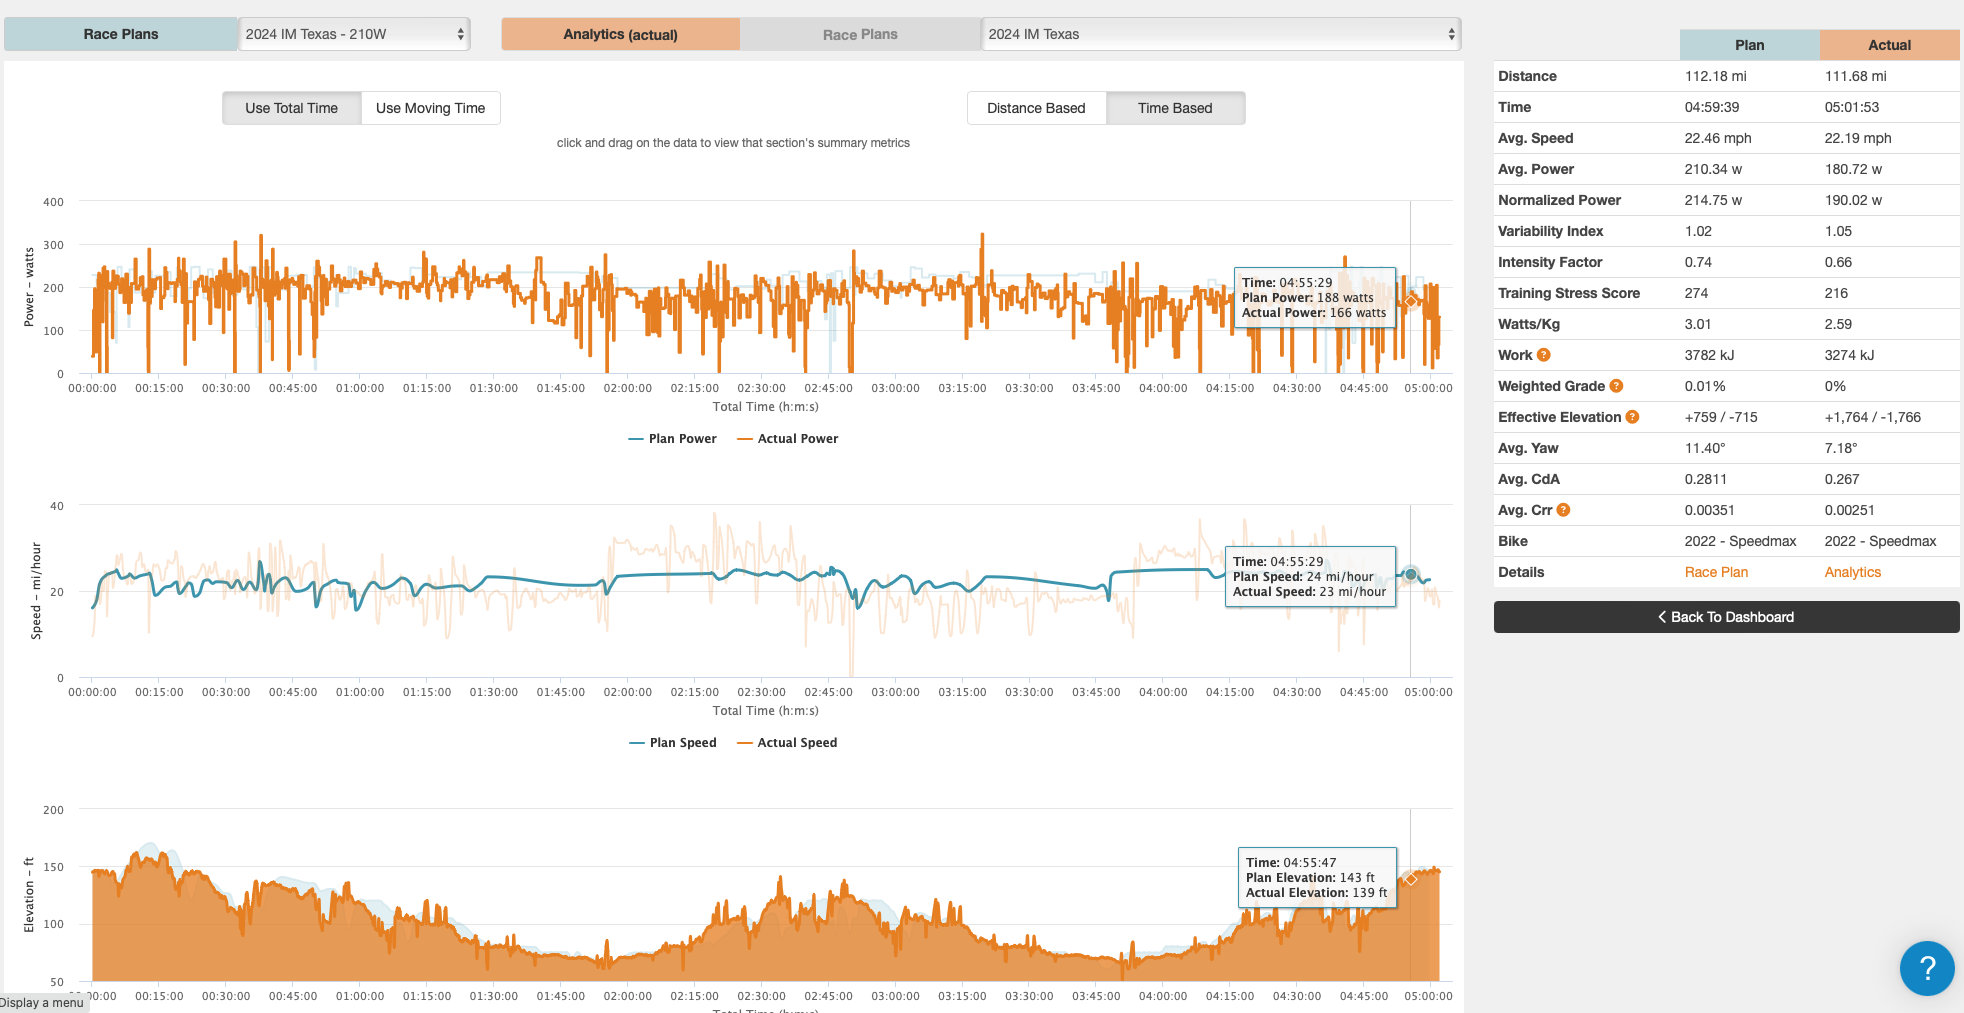

Trip wise everything went super smoothly. Arrived Wednesday, no delays or issues with baggage or car rental etc. Thursday, fun little cruise around the Airbnb in Spring and did packet pickup, and had a nice evening with the Fillnow folks. Prepped some of my bags and had a good amount of sleep. Friday got up and went to the practice swim, did a really easy few hundred yards (15 mins) and felt OK. I picked out some landmarks to sight off. I used my wetsuit and felt very normal. Had some breakfast, got to meet Natasha from NVDM as mentioned, and took it easy. Had some pasta for lunch and in the afternoon did bike drop off, and took it easy for the rest of the day. Ensured I was getting in plenty of hydration (LMNT + water) and carbs. Friday evening got to bed really early (9pm) since I knew I was going to be up at 4am, ended up waking up at 2:30 and felt ok. Found parking pretty easy, got into T1, loaded nutrition/hydration. I had a minor issues getting air into my rear disc, but got it sorted out pretty easily. Walked over to Swim start, got into my wetsuit, and started just behind the main pack. Also no real delays, issues or surprises 🙂
It has been a great 16 weeks training for Ironman Texas coming up next week. One small injury (foot) from either running or pushing too hard off the wall while swimming. Some interesting stats through these training blocks:
Longest week: 18 hours
Max CTL: 116
Max TSS: 144
Cumulative Miles: 2161
3 week blocks, with 1 week rest. 2 week taper into the race.
Compared with past Ironman races, used the sauna during the last 3 weeks to get more heat adapted, and did a little more strength based workouts. (Not tracked in Intervals). I also focused more on Z2 efforts while running. The Oak Island Half Marathon got me running a lot more early season. Overall, I had some good PR’s during the last 4 months:
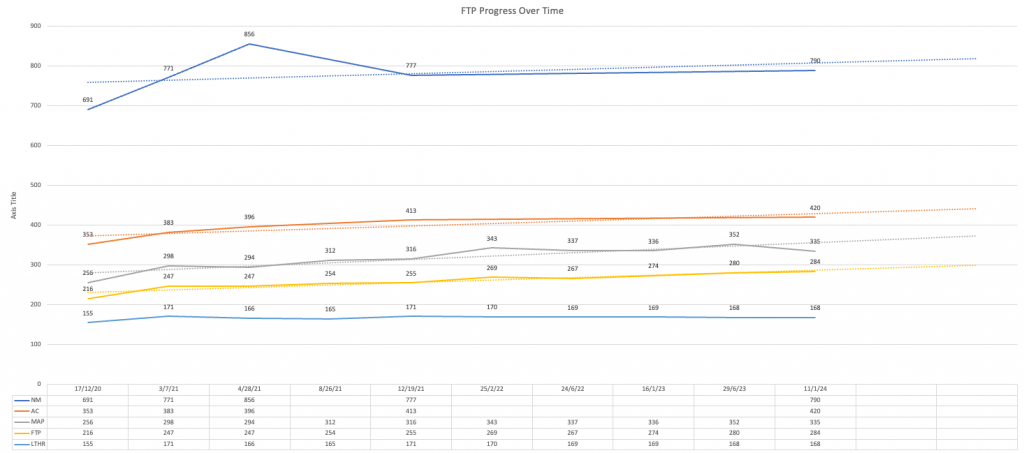
Tracking cycling endurance training progress over time. As I have shifted my focus from MTB racing to Endurance/long distance triathlon, My sprint power has decreased slightly (5 minutes and 1 minute) but FTP (20 min+) has slowly been ticking upward. Since I have been swimming and running more, it probably has not increased as much as I hoped, but I am learning endurance is not something that gets established overnight ….
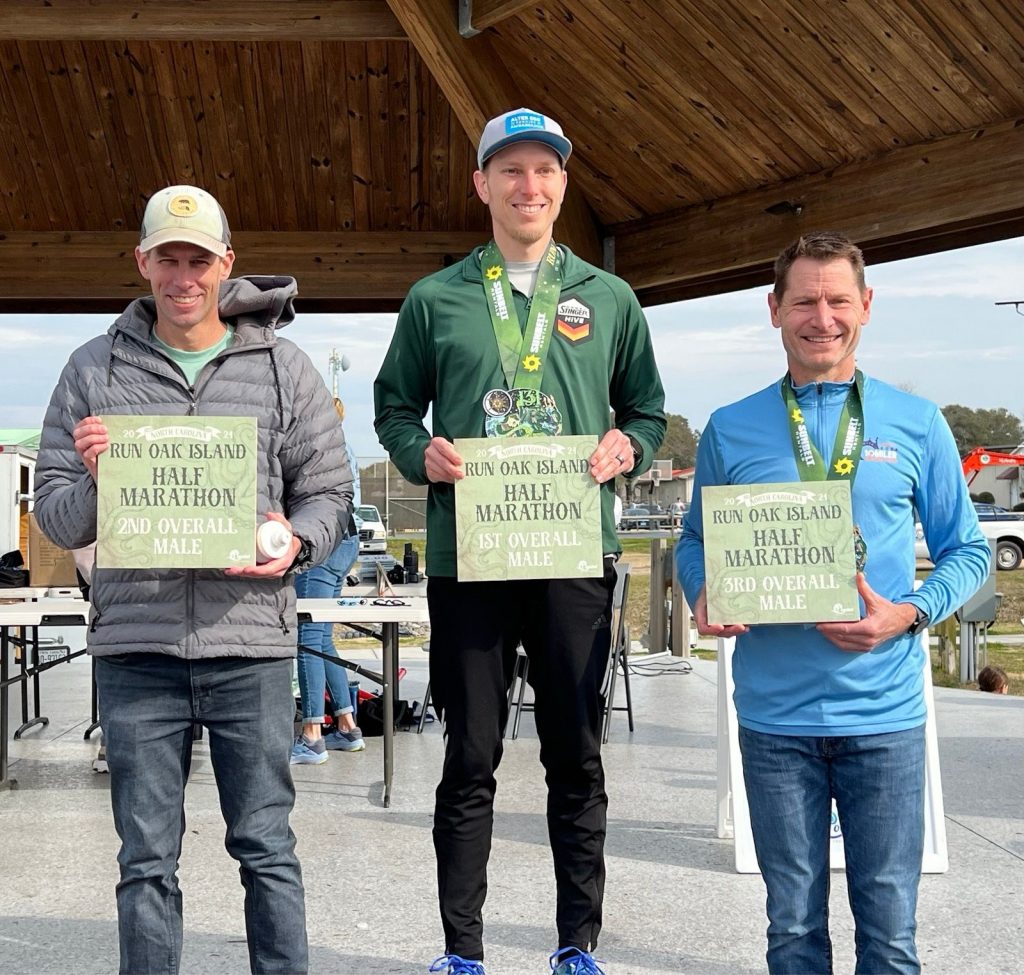
A fun start to the 2024 season in Oak Island. I decided to do a Half Marathon to try and accomplish a one of my goals of breaking 1:20 over the 13.1 miles. This didn’t happen today, but it was fun trying 🙂
3rd Place Overall, 2nd Place Overall Male.
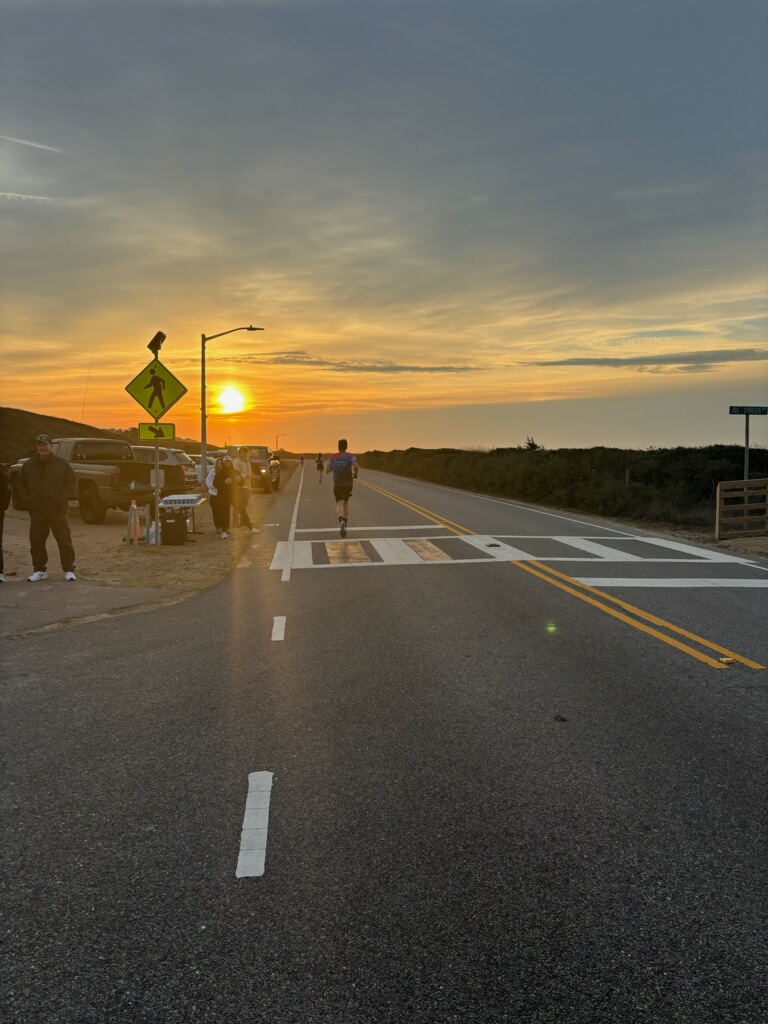
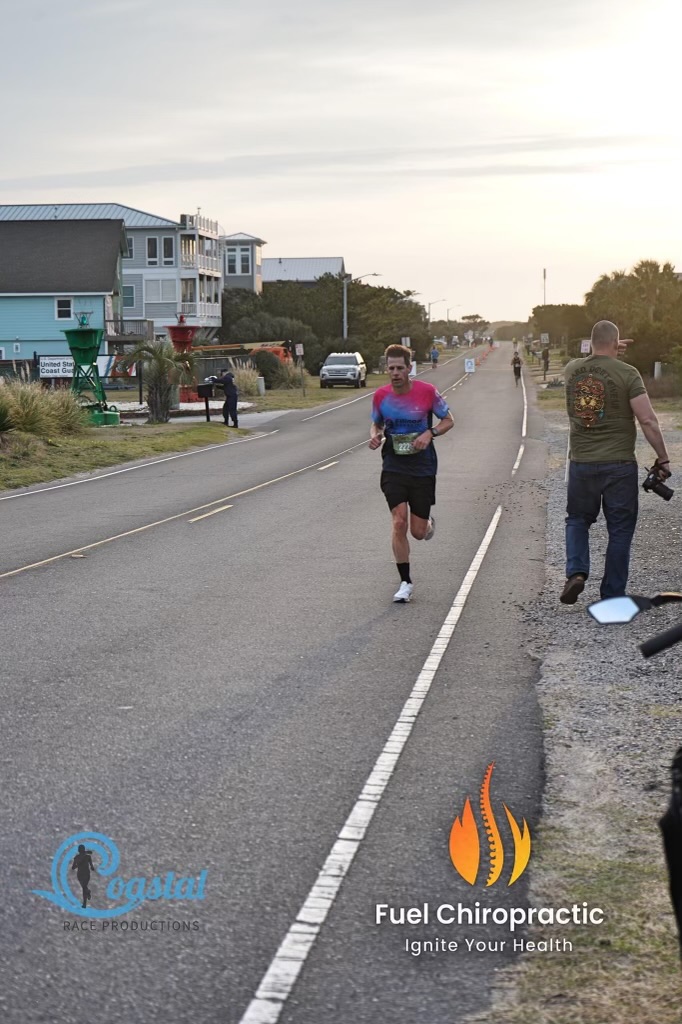
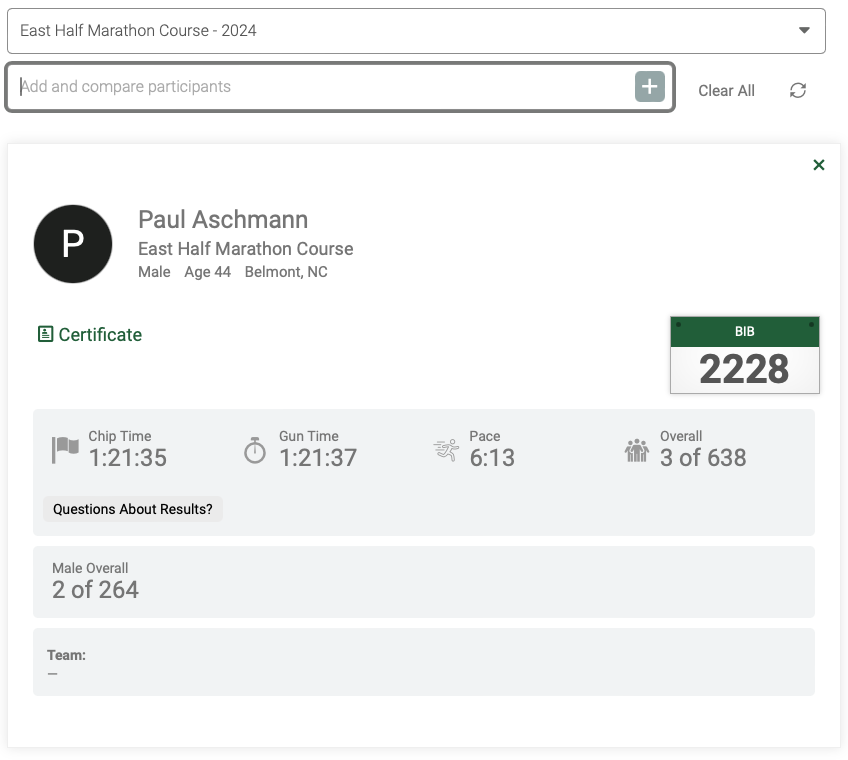
I think I started out at the right pace around 2 – 3 secs faster per mile than planned, I knew going out would be down wind, and coming back was into the wind, so I tried to bank a little bit of time for that. I think I didn’t anticipate the wind being that strong. At the time 2nd place was slowly pulling a gap which also wasn’t motivating, but then seeing that I was making up some time on 3rd place kept me pushing. So mentally it was a little tough on my way back in as once I passed 3rd place I didn’t think I could catch 2nd. With about a mile or mile and a half to go, I took a look back and had dropped 3rd, I also realized I was not going to make 1:20, so backed off a little.
Super interesting article on the use of Hypoxanthine (from sweat) being used as a predictor of performance in athletes.
Having done HR tracking, Power and over the last couple of years, Lactate, it’s always interesting to hear of new methods and advancements in performance, and opportunities to improve metabolic health. So while I am still waiting for a reasonable/practical real-time Lactate monitoring solution, maybe I should skip to the next big thing …
Check it out here: https://pubmed.ncbi.nlm.nih.gov/23670363/
Purine metabolism reflects the exercise-induced muscle adaptations and training status. This study evaluated the utility of plasma hypoxanthine in the prediction of actual sport performance. We studied male athletes: 28 triathletes (21.4±2.9 years), 12 long-distance runners (23.2±1.9 years), 13 middle-distance runners (22.9±1.8 years) and 18 sprinters (22.0±2.7 years). Season-best race times were considered, achieved over standard triathlon, 5 000 m, 1 500 m and 100 m, respectively. Incremental treadmill test was administered to determine maximum and “threshold” oxygen uptake. Resting and post-exercise plasma concentrations of hypoxanthine, xanthine, uric acid and lactate were measured as well as resting erythrocyte hypoxanthine-guanine phosphoribosyltransferase activity. Simple and multiple regression analyses were used to identify significant contributors to the variance in performance. Hypoxanthine considered alone explained more variance in triathletes, long-distance runners, middle-distance runners and sprinters (r 2=0.81, 0.81, 0.88 and 0.78, respectively) than models based on aerobic capacity and lactate (R 2=0.51, 0.37, 0.59 and 0.31, respectively). Combining purine metabolites and cardiorespiratory variables resulted in the best prediction (R 2=0.86, 0.93, 0.93 and 0.91; r=0.93, 0.96, 0.96 and 0.95, respectively). In summary, hypoxanthine is a strong predictor of performance in highly trained athletes and its prediction ability is very high regardless of sport specialization, spanning the continuum from speed-power to endurance disciplines.
I did a lot of running, riding and swimming 🙂
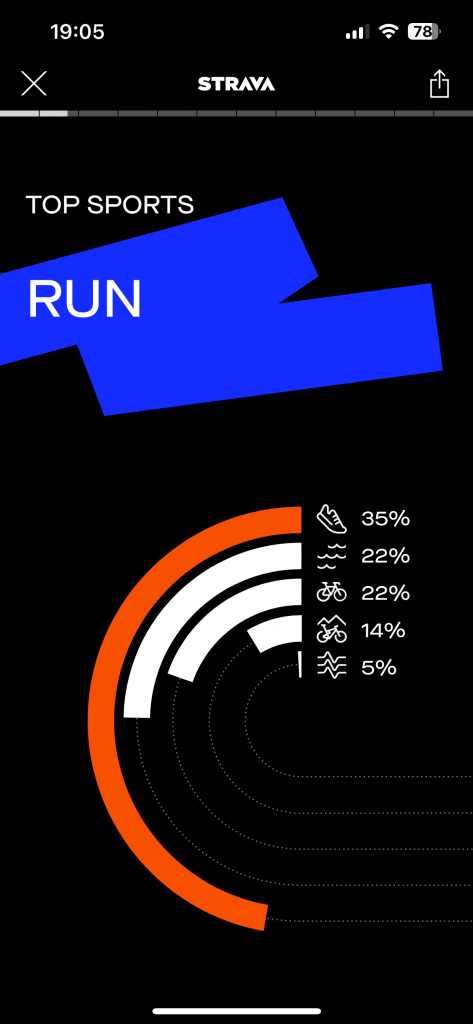
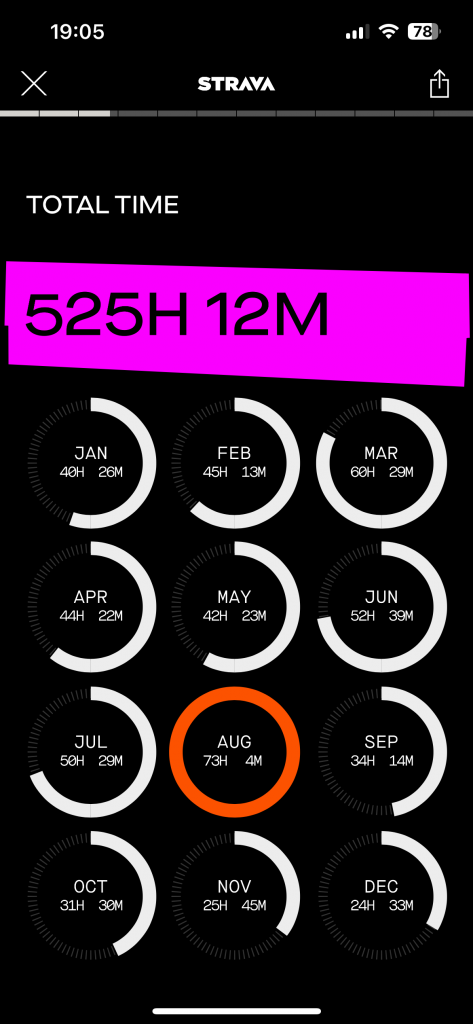
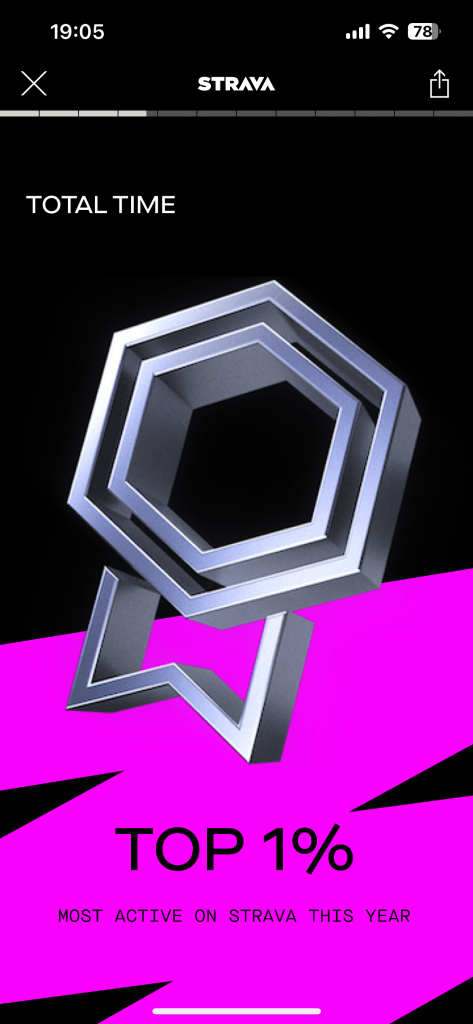
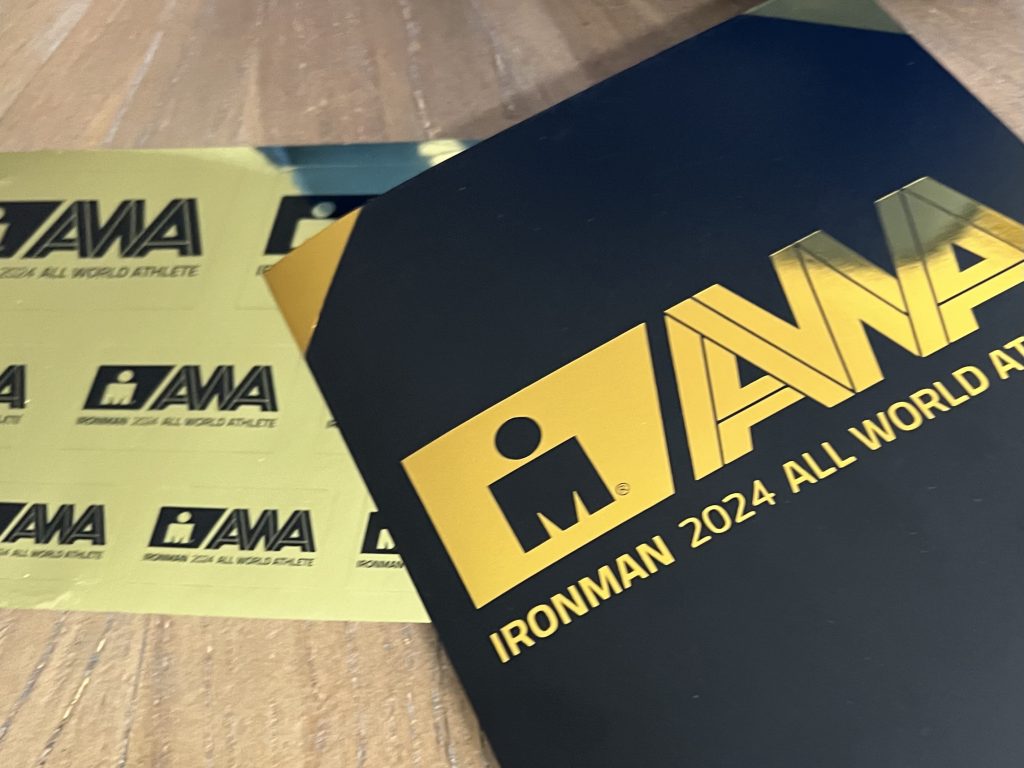
Basically a loyalty program from Ironman … but proud that I received the Gold (Top 2%) AWA Status for 2023.

I *just* received my order of the hDrop gen 2 wearable hydration monitor, and used it for a short 45 min easy Zone 2 run. Based on my interest of sweat analysis, I was curious to compare my results to other tests I have done in the past. I plan to continue to use it for more sessions, and it will be interesting to see how the results fluctuate with the seasons.
| Metric | Previous Value | Per hDrop | Notes |
|---|---|---|---|
| Avg Sweat Rate | 37Oz/h | 16.4Oz/h | My previous values were cycling, temps were relatively cool |
| Avg Sodium Concentration | 716mg/L – 1023mg/L | 901.1mg/L | Range of 5 tests, last 3 were all at 1000mg/L +- 50. |
After my first quick and dirty test, the unit is probably quite accurate on the sodium concentration, but I am unsure about the sweat rate. My past sweat tests were done based on weight loss during the exercise, cycling (not running) and majority were indoors. Based on the effort and ambient temp, I think around a 500ml sweat loss seems correct.
Sweat, and specifically Sodium, is one of the three “levers” for endurance athletes when it comes to hydration and nutrition (fueling) and subsequently your performance. The other two key elements or levers are Carbohydrates and Fluids.
The most important part about sodium/sweat is that everyone has a unique sweat loss rate, and a unique sodium content ratio in their sweat. So while a more generalized approach can be defined for consuming carbohydrates, the same is not true for electrolyte loss. This is why having a sweat test is critical for athletes wanting to perform, understand and take advantage of their data to understand their personal needs and requirements.
You must be logged in to post a comment.