Introduction
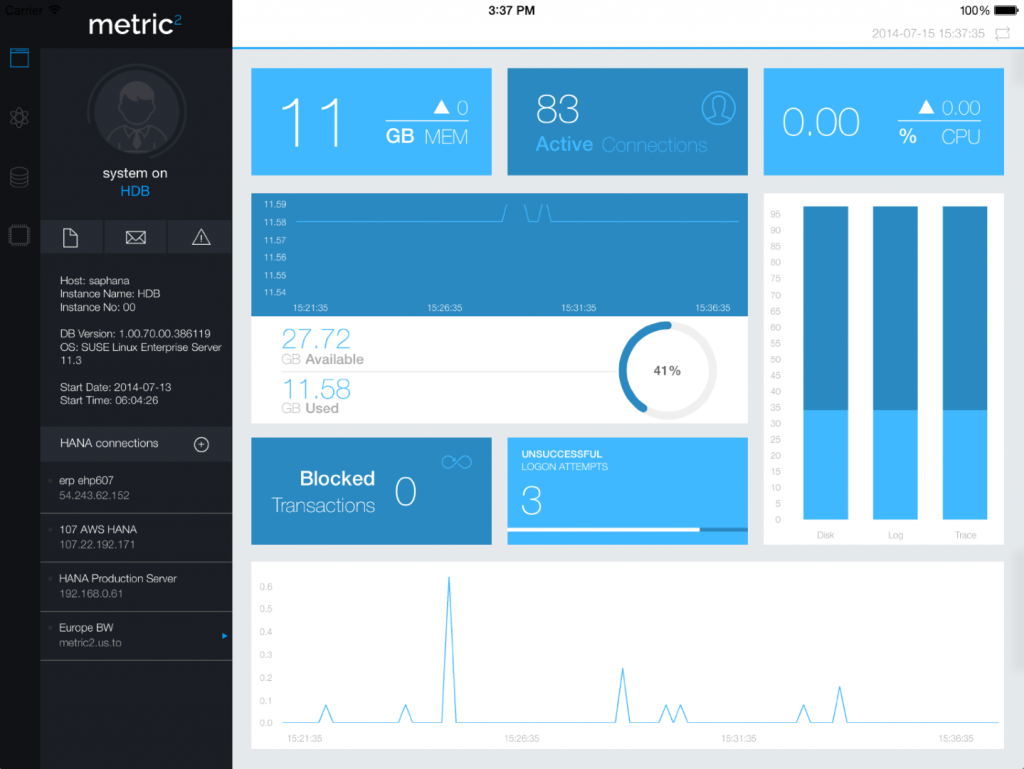
After developing multiple iOS apps (SAP Note Viewer for iPad (SAP Note Viewer for iPad) and iPhone (SAP Note Viewer for iPhone), iOS CRM (iOS CRM for SAP and iPad – A free Mobile CRM App)) I recently stumbled across one of my biggest hurdles so far (aside from learning Obj. C!) in creating a Sales dashboard within a native application. Charting and Graphing in business applications, including SAP, is a everyday necessity providing users, managers and CEO’s a visual representation of important, monotonous and a downright boring set of data.
Dashboards, charts and graphs have become a common place within organizations and new releases of Business Objects BI 4, are making these easy to deploy, user friendly, interactive and can be very helpful in making game time decisions. Utilizing these visualizations from a mobile platform is something which is being actively developed ({code:html}Business Explorer for iPhone{code} for example) but currently there are very few plugins/frameworks/controls or libraries which make adding custom visualizations to your XCode project easy. A good example of some great looking charts in iOS would be Roambi (http://www.roambi.com/). In my quest to solve this challenge I came across a solution which allowed me to mashup javascript and objective c creating a solution which is working fairly well so far and felt like some others developing on this “newish” platform might find helpful. While my solution does not come close to being comparative to products like Roambi, it does provide some tricks to making charting fairly simple for anyone wanting to do so. This post will be read more


You must be logged in to post a comment.