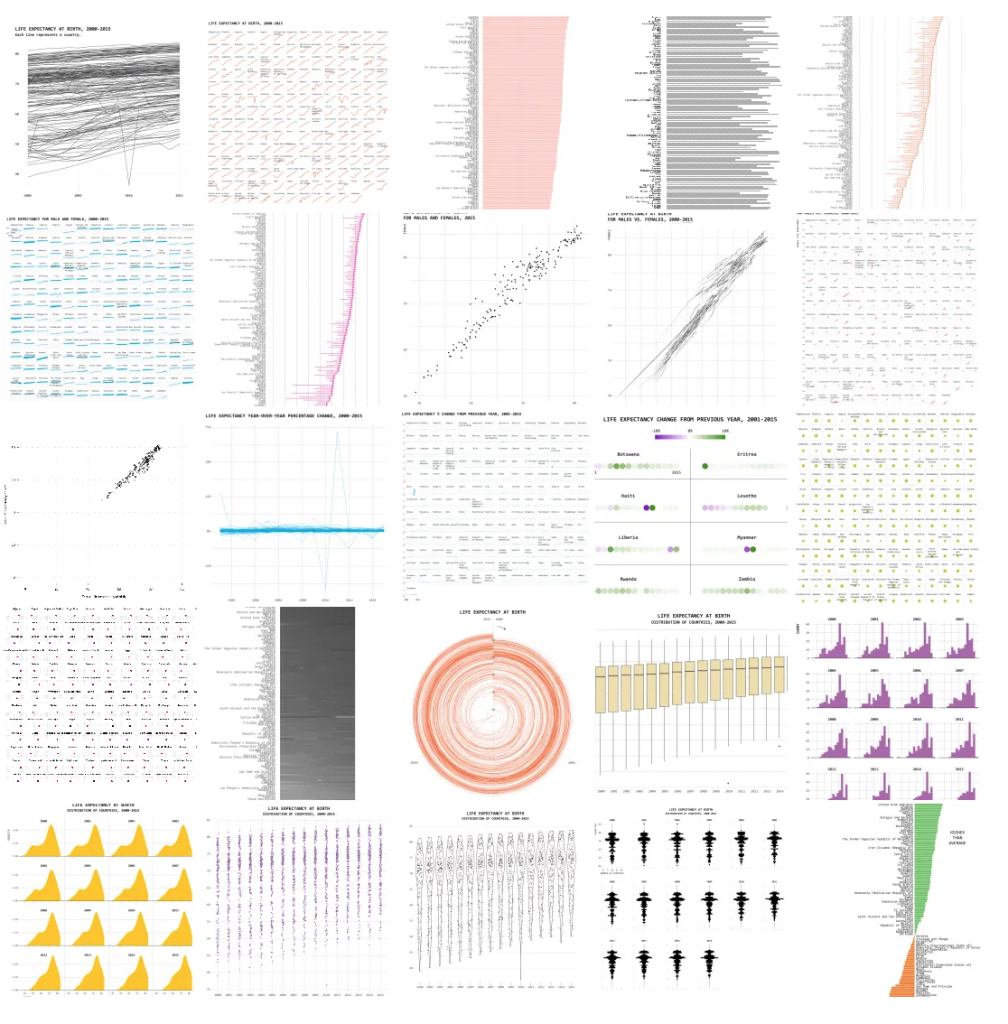
One dataset visualized 25 ways … Posted on January 25, 2017May 3, 2020 by paschmann One Dataset, Visualized 25 Ways
You must be logged in to post a comment.