After releasing metric² at TechEd Las Vegas last year it has had well over a hundred downloads, and has a couple loyal followers always offering advice and feedback (which I am truly thankful for). Last week we released version 2.0 of the free and open source app and subsequently put it onto GitHub under the MIT license which you can find here.
The biggest changes of the new version of metric² include:
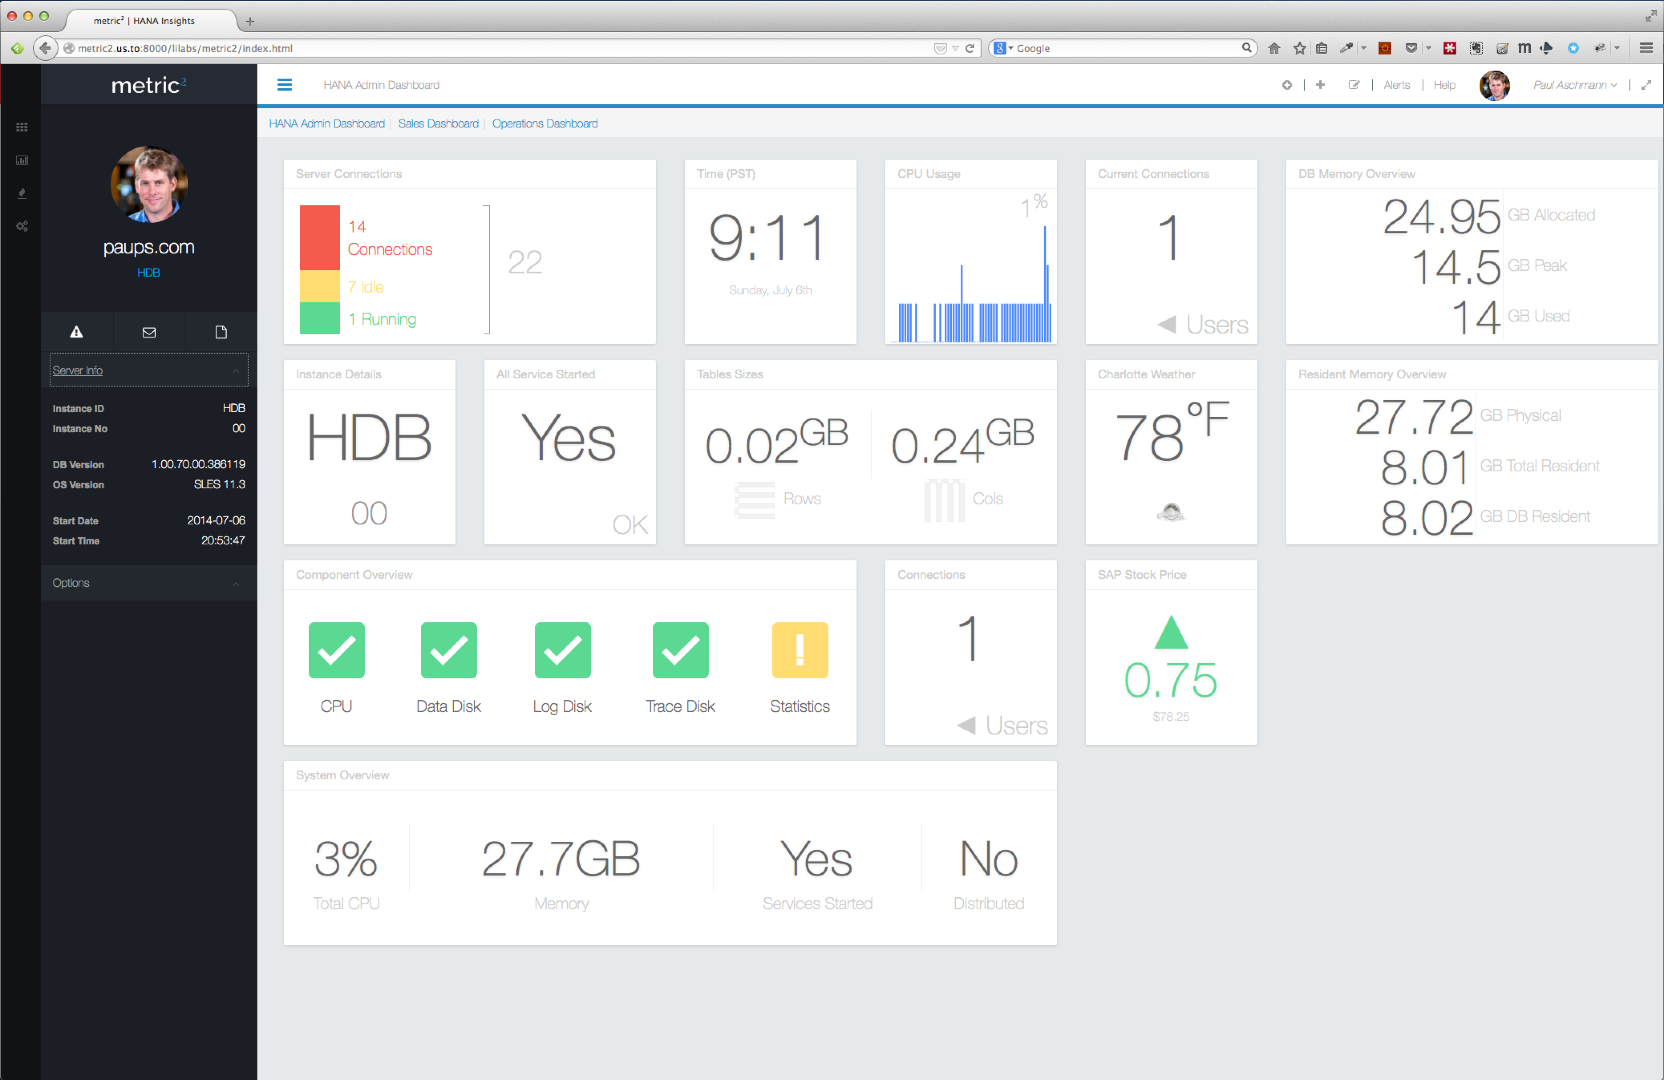
- A new UI (Twitter bootstrap based)
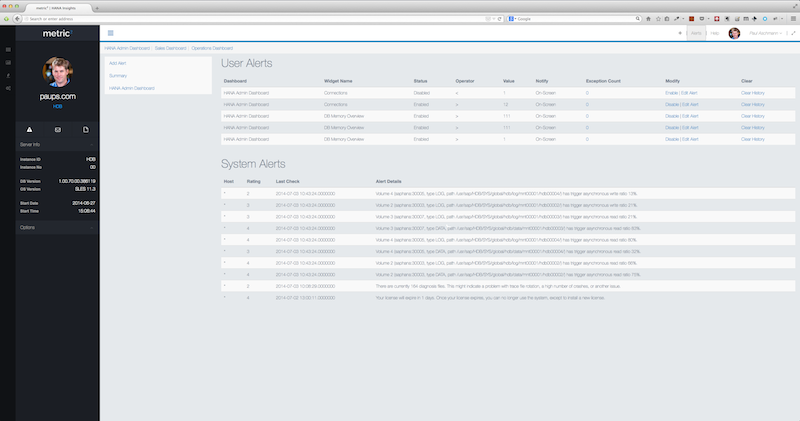
- The ability for users to create their own account
- A few new metrics
- No longer uses SAPUI5 (a blog post in itself!)
- The biggest change was the front-end/UI and the code has been refactored and split up into multiple library files (XSJSLib) and is simplified for easier reading.
The primary goal of the app is, and always has been to try and visualize your big data. Along with providing a self service tool to monitor and provide insights on the data you have in, and around your HANA system, while using it to the fullest.
Short Survey
I am in the process of trying to understand where to take the app in terms of use and direction and if you are interested in helping guide the discussion, if you have downloaded, used or seen the app I would greatly appreciate if you took 1 minute to complete a short 5 question, multiple choice survey here.
(Read further below for Future updates and the mobile app) ,,,
Below are a few screenshots of the new version (2.0):


Mobile App
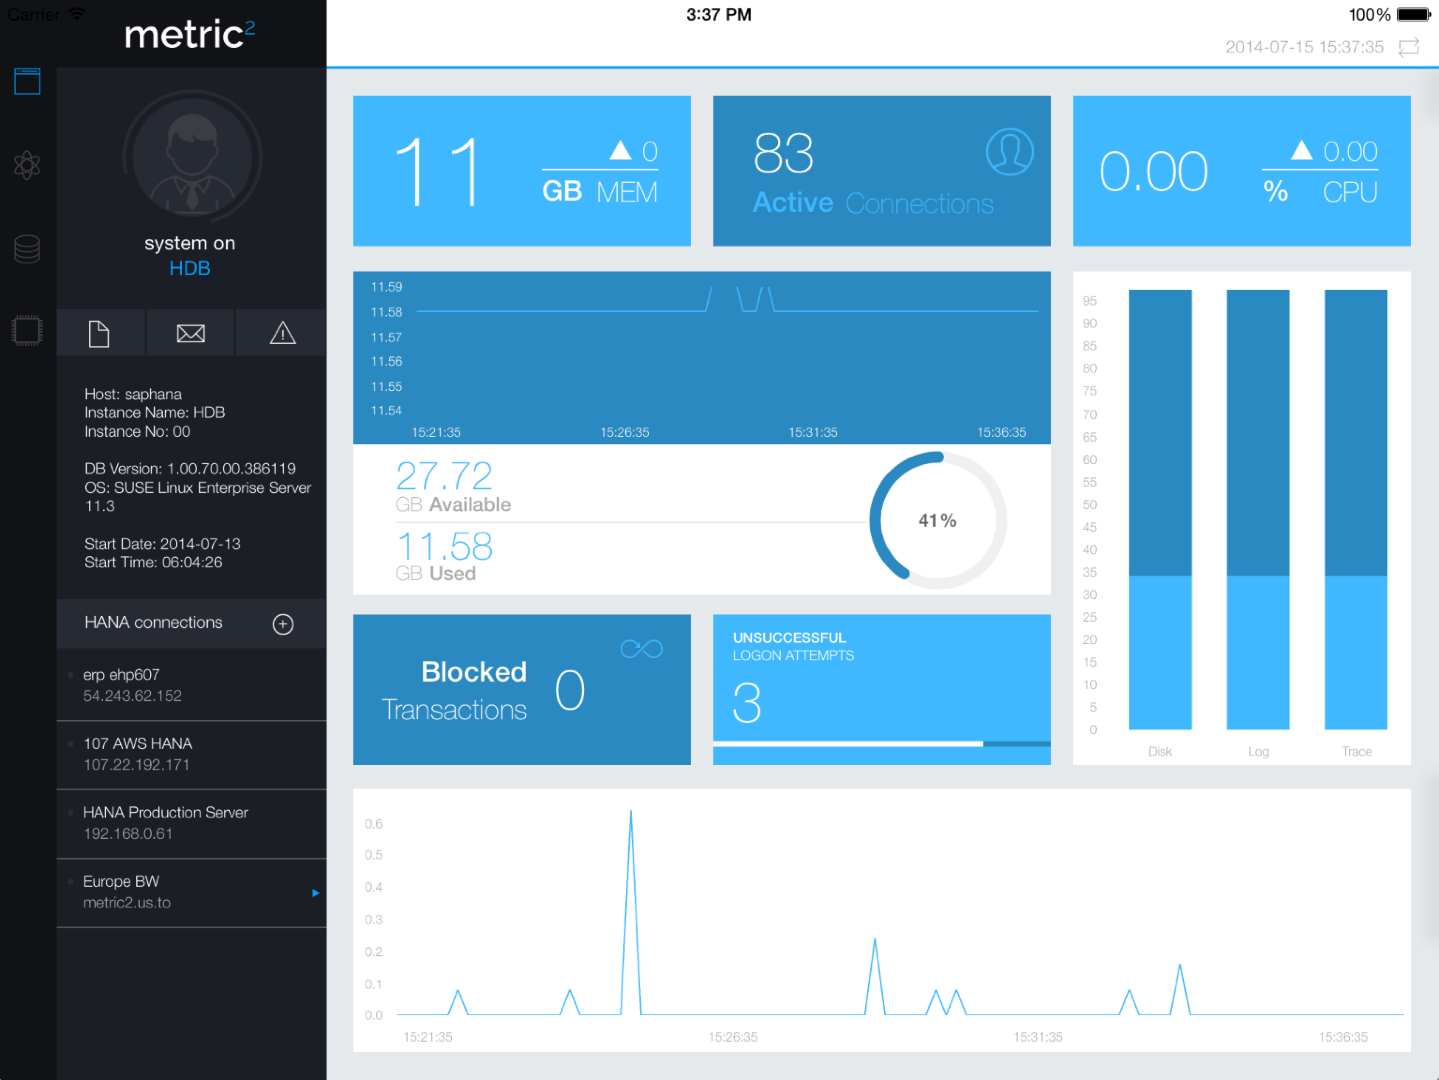
If you are a HANA admin, or are simply managing your own dev instance for learning HANA, a new iOS app called metric2 – Admin, will be in the app store within the next month, it will be a free app with some pretty basic core metrics centered around HANA performance/availability. Below are a few screenshots of the upcoming mobile app:


Next Release
A couple of new features for the upcoming release (v2.1) are centered around some new metrics, including support for iBeacon devices (upload a map, designate regions and you can monitor and track from the live dashboards). Another metric in the process of being developed is around quickly and easily showing twitter sentiment using your HANA instance. Using HANA Live views will also be included as a data source option for the metrics allowing you to make use of the predefined SAP designed views. From a code perspective I am in the process of pulling out widgets to be independent, upgradable and customizable without touching the core code.
As usual if you are using the app in your environment I am always looking for ways to improve it and the feedback provided so far is invaluable. Feel free to leave a comment or reach out to me here on SCN
